We have reviewed data for sales of homes in 5 towns in Southeastern Connecticut and compared this data to equivalent data in the larger New London County. This review covers quarterly data for the years 2012 through 2016. It is an update to an equivalent review done last quarter.
Numbers Sold & Days on the Market – New London County
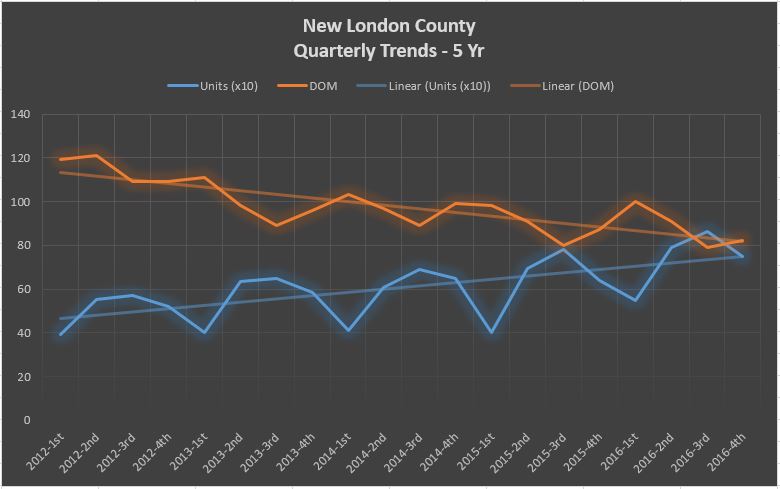
We start with the chart below which shows a couple of things about residential sales activity in New London County overall.
First, the “DOM” line plots the average number of “Days on (the) Market” for corresponding listings of homes in New London County prior to sale. The straight line through it is a “linear trend line” for this data – courtesy of MS-Excel. It suggests that the number of days a home remains listed prior to selling has dropped from roughly 4 months to a little under 3 months over the past 5 years. Even though there was a slight uptick last quarter, the “DOM” average remains close to as low as its been over the past 5 years.
The “#Sold (x10)” plots the average number of homes sold per quarter (divided by 10 in order to make the plot more compact) in New London County. The straight line through it is a “linear trend line” for this data – again courtesy of MS-Excel. This data suggests that over the longer term, the number of homes sold per quarter has increased significantly, from a little over 400 (40 x 10) to a bit under 800 (80 x 10) on the average considering the steady quarter-related fluctuation.
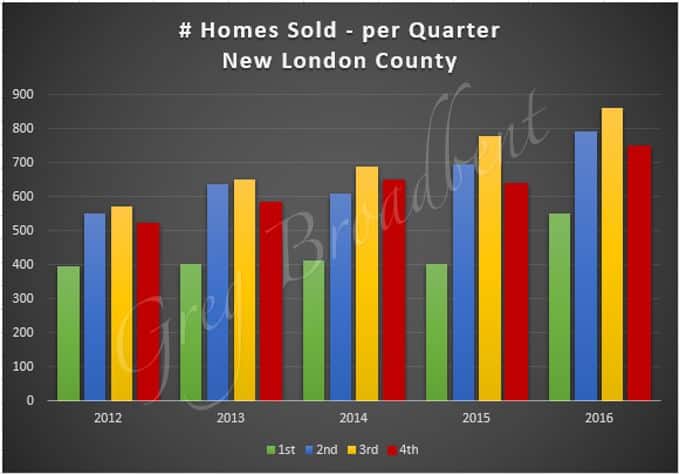
But as the next chart shows, if you compare activity for each quarter year-to-year, there has generally been an increase in activity for the same quarter each year.
Numbers Sold & Days on the Market – Local Towns
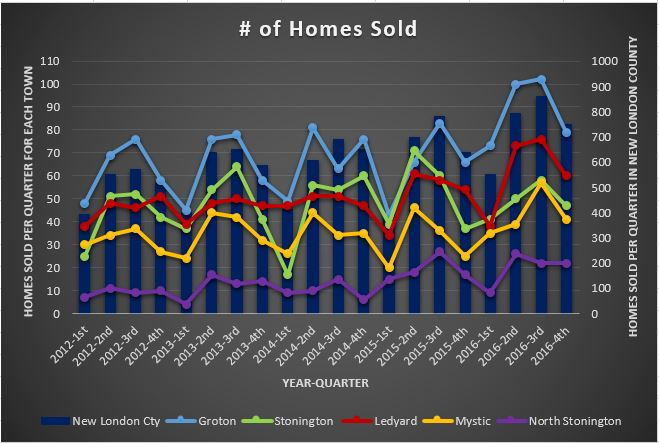
Next, we look at two charts which show the same data for the five (5) Southeastern CT towns.
The chart to the left below shows the number of homes sold per quarter for each of the towns over the same period; for reference, the New London County data is shown in columns in the background. The sales in each town roughly follow the same quarter-related fluctuation of weaker and stronger sales, and they roughly track with the New London County data. However, in the local area, Groton and Ledyard seem to have the most noticeable overall upticks in completed sales.
|

|
The chart to the right above shows the average number of days corresponding listings for homes that sold per quarter were active for each of the towns over the same period. The New London County data is shown in columns in the background. With some exceptions, local towns don’t track with the larger county very well, and the ADOM for homes in this set of SE CT towns is typically longer than the averages for New London County as a whole.
Closing Prices – New London County
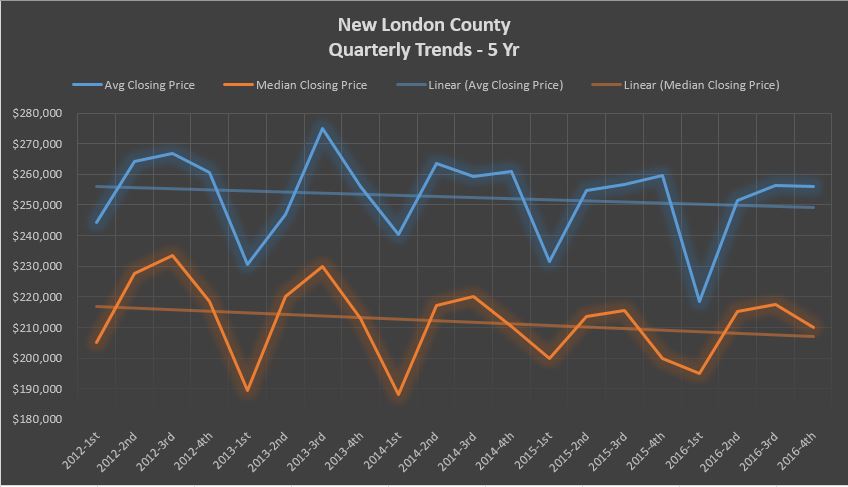
Next, we look at the quarterly average and median closing prices from 2012 through 2016. Again, “linear trend lines” from MS-Excel are provided for this data as well.
Although the closing price is influenced by many factors which are not reflected in this data (living area, numbers of bedrooms and bathrooms, etc.), the data suggest that both closing price metrics are trending downward generally.
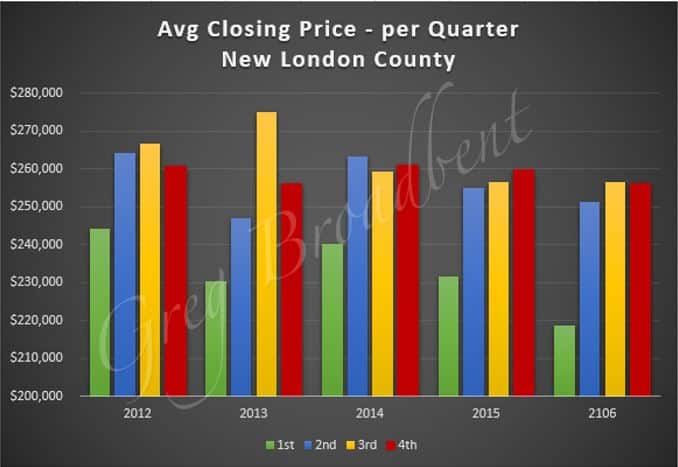
The next charts make it easier to compare activity quarter-by-quarter across the years. It seems that the average closing price represented in the chart on the left below has been fairly steady for the past three years in the 2nd, 3rd, and 4th quarters between $250K and $260K, although the 1st quarter average has been decreasing. The average closing price measure seems to be stabilizing more that the median closing price measure in the overall county.
|
|
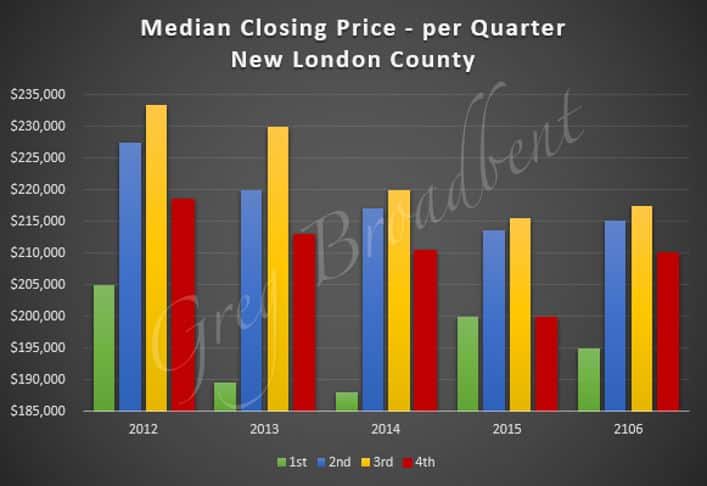
The chart on the right above shows the average median price dropping steadily in a quarter-to-quarter comparison from 2012 to 2015 (with the exception of the 1st quarter). However, there was a marked quarter-to-quarter increase in the median price from 2015 to 2016, which is encouraging. Taken together, this data might be taken to imply that prices are at least stabilizing if not getting ready to improve.
Closing Prices – Local Towns
Next we look at the same data for 5 towns in the local area.
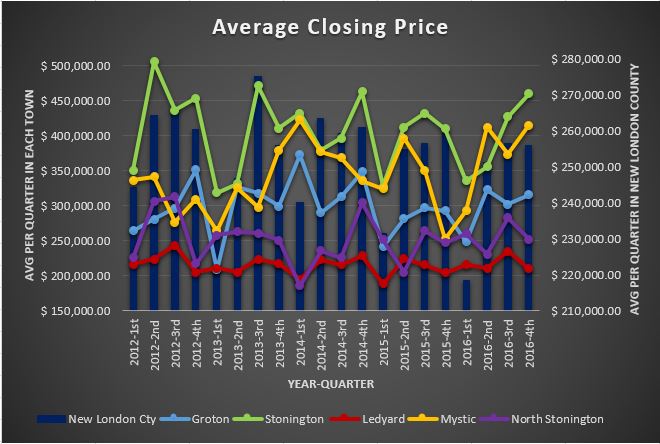
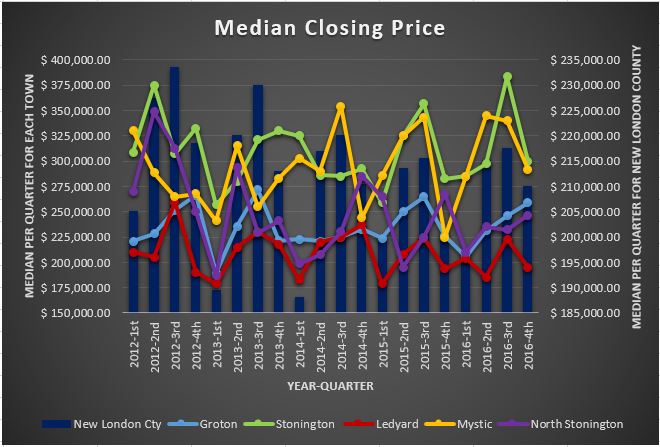
The chart to the left below shows average closing price per quarter for homes sold in each of the towns over the same period; the chart to the right below shows median closing price per quarter. For reference, the New London County data is shown in columns in the background. Note the ranges for the New London County averages and medians (shown on the right-side margins) are in a narrower range than the corresponding measures for the 5 SE CT towns. The average and median closing prices in all 5 towns tends to be similar to or greater than the corresponding measures for the larger New London County.
|
|
However, the trends for both measures fluctuate widely across the quarters for all 5 towns and don’t seem to reliably track with data from the larger county. It is encouraging to see some of the recent data points close to or exceeding high points from earlier years. For example, the 3Q16 median exceeded the 2Q12 median in Stonington. The 2Q16 and 4Q16 averages for Mystic are close to the previous 5-year high in 1Q14.
With the smaller number of data points (at least relative to the number of data points in the larger county data set), a greater degree of fluctuation is to be expected in the local data. In the quarterly town-specific reviews that we do, we account for this fluctuation by using 12 month quarterly “rolling averages” for similar considerations.
We’ll continue to watch the residential property market in the local area and bring you additional observations and data in future blogs. If you’re interested in getting more information about these 5 towns (among others) in Southeastern Connecticut – check these reviews out!
The New London County data used above was taken from the Eastern Connecticut Association of Realtors site, and the local data reported above was based on data obtained from the CTMLS as of 1/3/2017.
If you are looking for homes for sale in Southeastern Connecticut or if you would like to work with a CT Realtor in the area, please contact us today. We would love to help you buy or sell your next home.


