We have reviewed some of the trends in sales of homes in the local area comprised of Groton, Stonington, Mystic, Ledyard, and North Stonington and compared them to trends in the larger New London County using quarterly data from 2011 through the 1st quarter of 2016 to see if the patterns are similar.
The chart below shows the number of homes sold by quarter for the past 5 years for New London County (Count-NL) and the local area comprising of Groton, Stonington, Mystic, Ledyard, and North Stonington Realtors in the respective areas. The local activity seems to generally represent about 25% of the activity in the larger county of which it’s a part. The county shows much larger quarter-dependent swings than the local area.
Linear trend lines were added (using MS-Excel) to see if there is a positive trend in the number of homes sold, and the number of homes sold year over year does appear to be increasing both in the local area and the larger county.
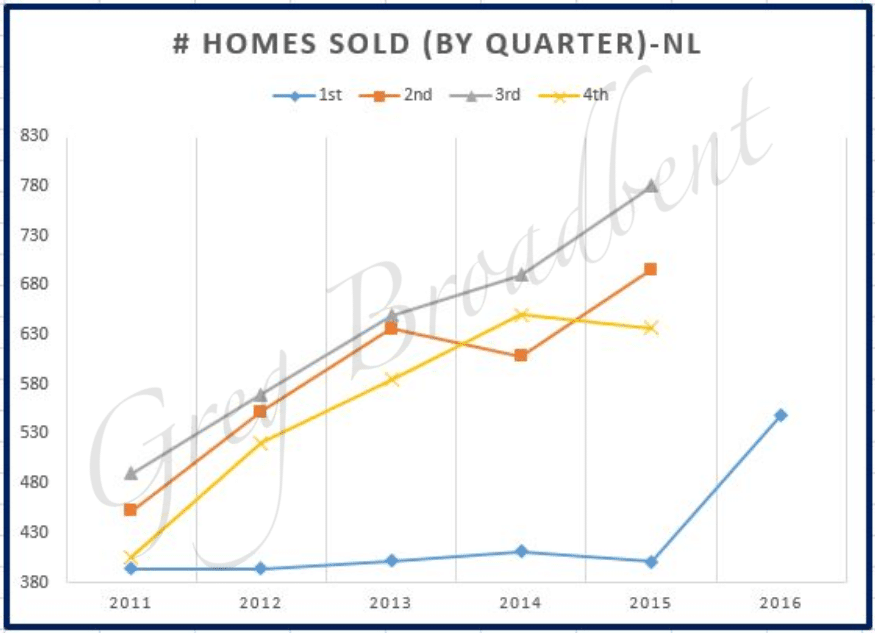
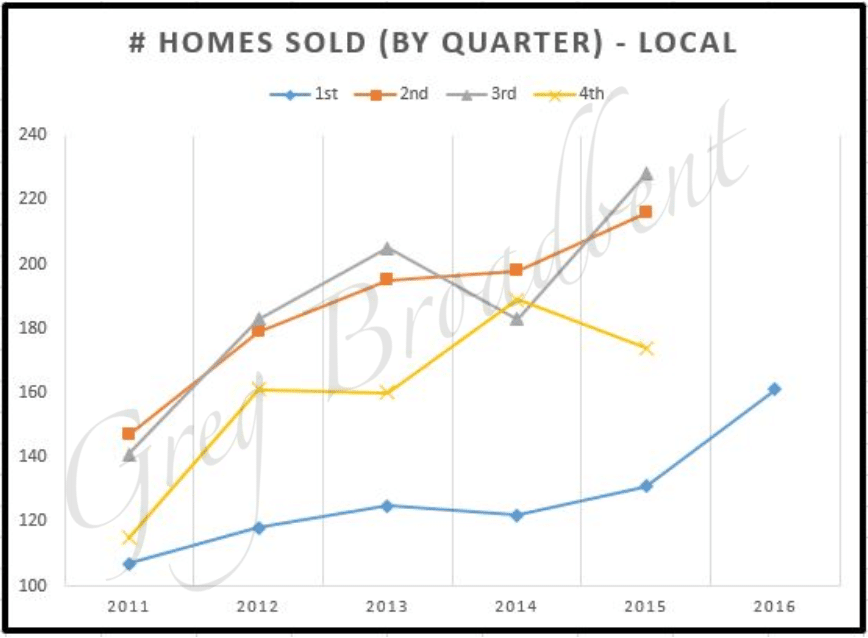
It’s a little easier to see if we look at the data broken down by quarter. As can be seen in the charts below, the trends for each quarter individually are generally improving,
But less so for the 1st and 4th quarters than for the 2nd and 3rd quarters. New London County had a hiccup in the 2nd quarter of 2014, and the local area had an equivalent hiccup in the 3rd quarter of 2014. Finally, it would seem the local area does much better than the county in the 1st quarter.
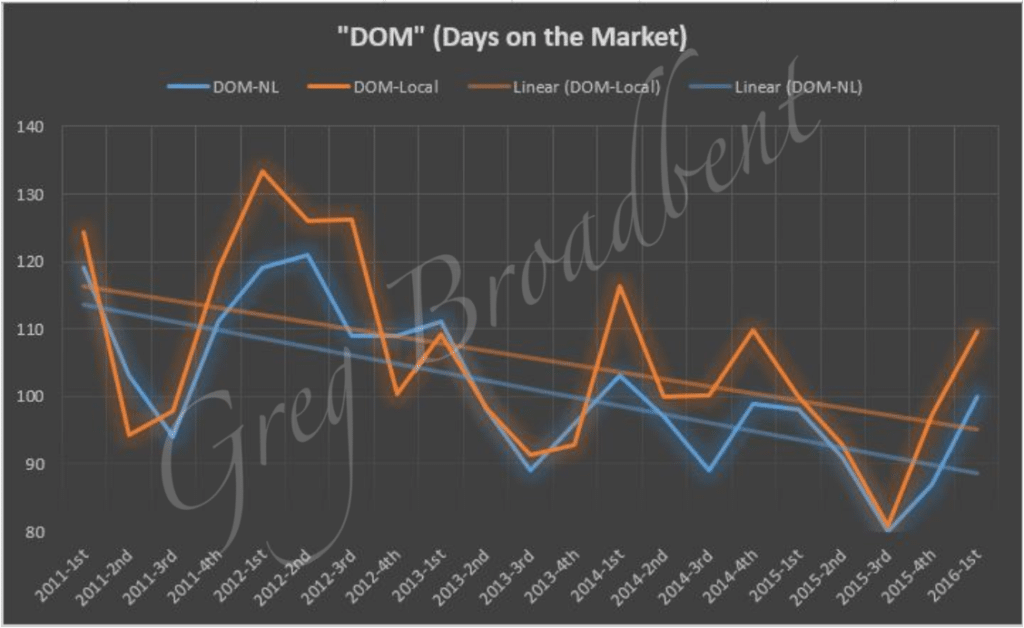
We can also look at the data for how long it takes to sell homes. The following chart shows averages for the “Days on Market” (DOM) for homes listed.
Although there were significant increases in the average DOM for the last two quarters in both the local area and larger county, the data indicates that the trend over the past 5 years is generally for shorter times to sell homes which is great news for sellers.
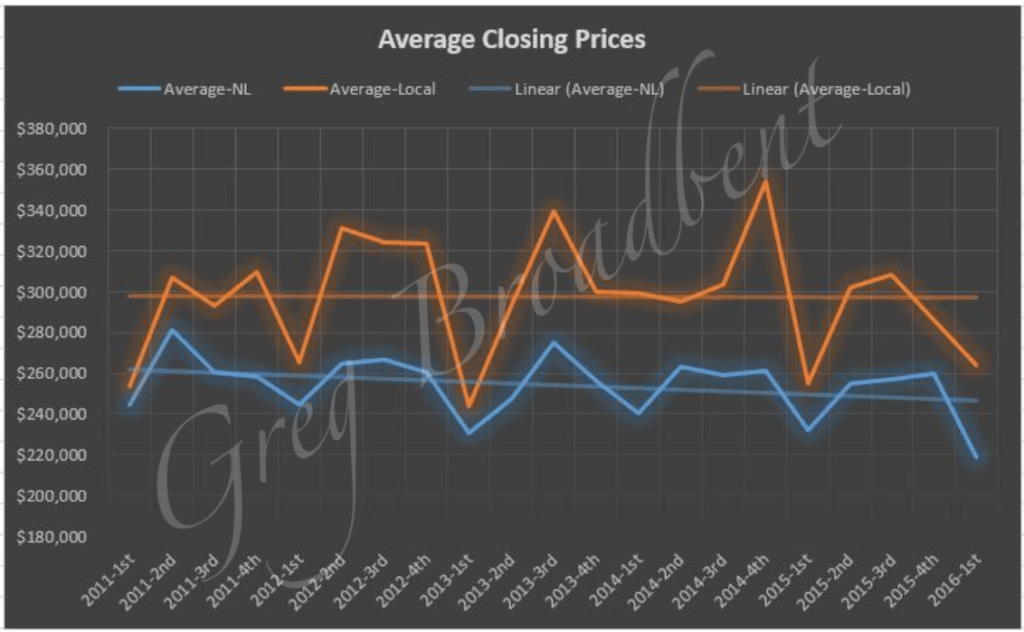
Another item of great interest is the average price at closing for a home. The following chart shows related data. While there seems to be a slightly negative trend for the larger county, closing prices seem to have remained flat for the local area.
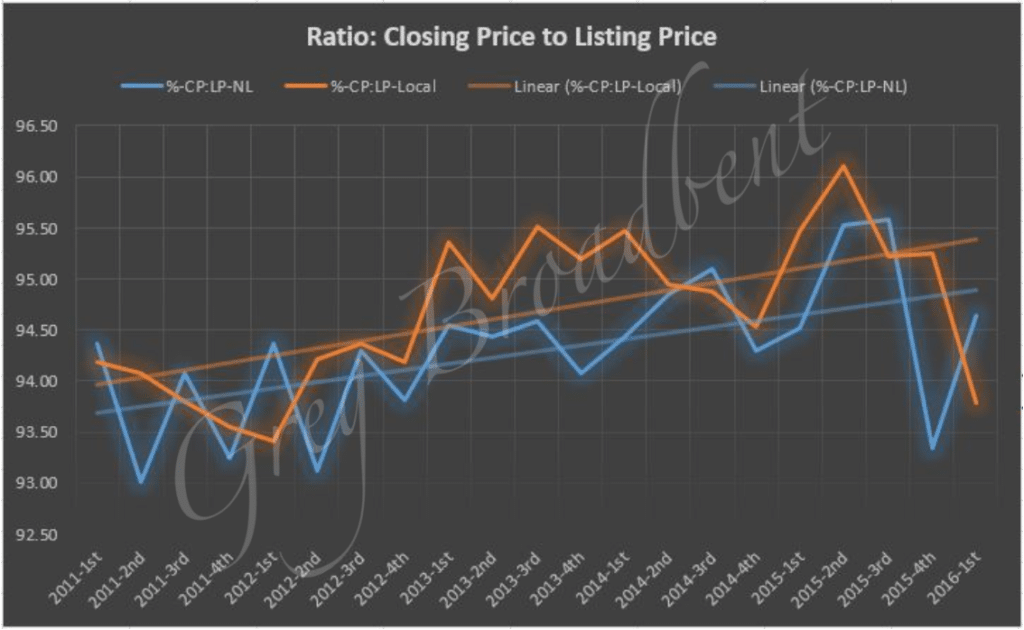
However, when you look at the ratio of closing price to listing price – an indicator or how much the seller reduced the price for the contract below what s/he was hoping to get, the trend seems to be more favorable with the trend line slightly more positive for the local area than the county.
We’ll continue to watch the residential property market and bring you additional observations and data in future blogs.
The New London County data was taken from the Eastern Connecticut Association of Realtors site, and the local data reported above was based on data obtained from the CTMLS as of 6/1/2016. If you are looking for homes for sale in Southeastern Connecticut or if you would like to work with a CT Realtor in the area, please contact us today. We would love to help you buy or sell your next home.


