
In summary, there were 71 homes listed for sale by local Realtors in Mystic as of January 3rd which was 5 fewer than the 76 listed on December 1st. This includes properties on both the Groton and Stonington sides of the Mystic River where 53 and 18 homes were listed respectively. Of these 71 listings, 59 were also active a month ago on December 1st, and 35 were active 3 months ago on October 3rd. 9 homes were listed as under deposit on January 3rd, all from the Groton side. Finally, 11 new listings were added in December – 10 from Groton and 1 from Stonington – and closing transactions were completed for 14 homes.
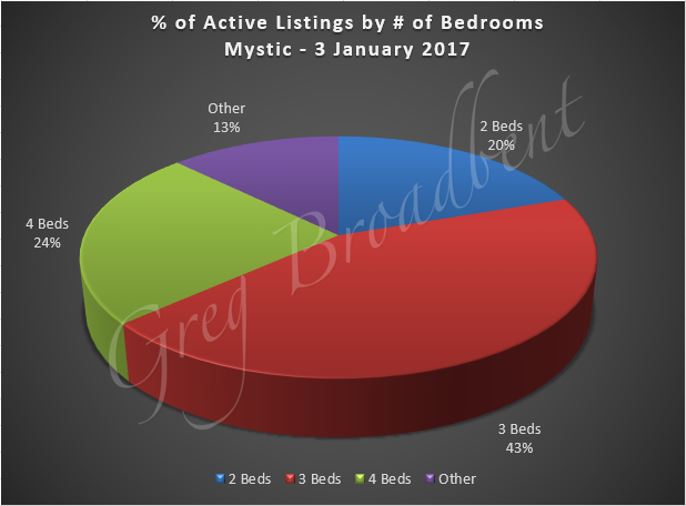
The size of the average house listed for sale in the overall Mystic area was around 2115 square feet with 3.25 bedrooms and 2.2 full bathrooms; 31 (~ 44%) of these 71 homes had at least one half bath. The following charts give some additional detail on the breakdown of available homes by number of bedrooms and ranges of living area across both areas of Mystic.
|

|
Looking at the Groton part of Mystic, the average living space was a little lower than the overall average at about 1970 square feet with 3.3 bedrooms and 2.1 full bathrooms. In the Stonington part of Mystic, the average living space was significantly larger at almost 2550 square feet with 3.2 bedrooms and 2.4 full bathrooms. In the Groton area of Mystic, 23 (~44%) of the 53 homes listed have at least one bathroom. In the Stonington area of Mystic, 8 (also ~44%) of the 18 homes listed have at least one bathroom.
Across all of Mystic, the average listing price was a little over $585,000. Prices ranged from almost $150,000 to $3,200,000; $410,000 was the median list price. The chart below gives a percentage breakdown of homes listed in different price ranges across all of Mystic.
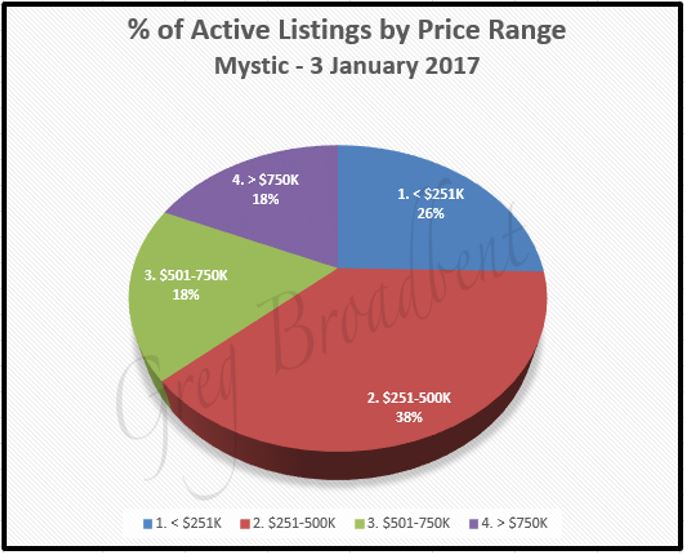
The average listing price on the Groton side of Mystic was just over $452,000 with the median price at $339,000 while the respective prices were a little under those at $985,000 and $599,000 for the Stonington side.
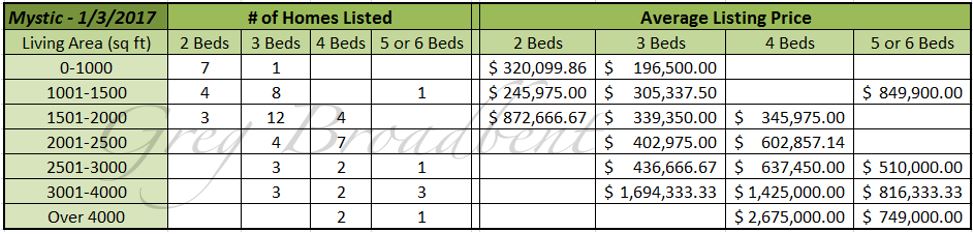
The living area and number of bedrooms are also related to the asking price. The following chart shows how the average listing price varies with number of bedrooms and living area, and shows the number of houses listed in each category, across all of Mystic.
There were 9 homes under deposit at this time, all on the Groton side of the Mystic River. The average price for these homes was just over $280,000 for an average home with about 1400 square feet, 3.33 bedrooms, and 1.33 full bathrooms. These listings were active for an average of about 105 days with the median at 69 days.
Closings took place for 14 homes in Mystic in December. This brought the total number of closings for 2016 in Mystic to 172, of which 139 occurred for homes on the Groton side of the Mystic River, and 33 on the Stonington side.
The average closing price for the 14 homes which closed in December was a bit under $325,000 with the median price at $297,500 and prices in the range from $142,000 to $725,000. The average number of bedrooms was 3.4 and 2.1 was the average number of full bathrooms. These homes were active on the market for about 125 days on average, but the median value for this metric was 62 days.
In comparison, the average closing price for the 41 homes which closed in the 4th quarter of 2016 was a bit over $415,000 with the median value much lower at $292,000 and the prices ranging from $112,000 to $4,000,000. The average number of bedrooms was 3.5 and the average number of full bathrooms was 2; 22 (~54%) of these homes had one half-bathroom also. These homes were active on the market for about 111 days on average, and 83 was the median value for this metric.
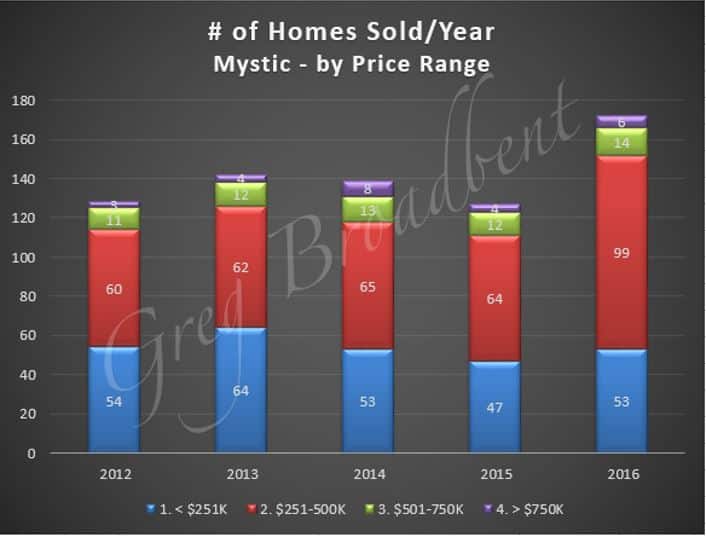
Looking at the longer term, the following chart shows the number of houses sold in Mystic as a whole since 2012, broken down by price range. The number of houses sold seems to have increased markedly, especially in the $251,000 to $500,000 price range, after holding more or less steady for the previous 4 years.
Next, the chart below shows a 12-month quarterly “rolling average” of closing prices for homes with 2, 3, 4, and 5-6 bedrooms as well as an overall average for the years 2012 through 2016. It suggests that closing prices more or less held steady except for the 5-6 bedroom homes which showed some sporadic increases but also some significant variation – not surprising since there were relatively fewer of these homes sold as suggested in the chart above.
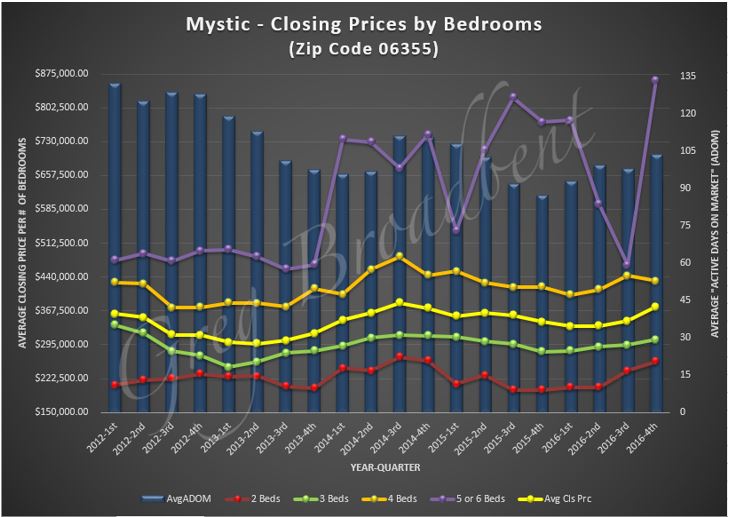
The blue bars in the chart above also show a 12-month quarterly “rolling average” for the number of days listings stayed active on the market for the same period. This suggests that the amount of time a home remains listed before being sold decreased after 2012 but has been trending upward recently.
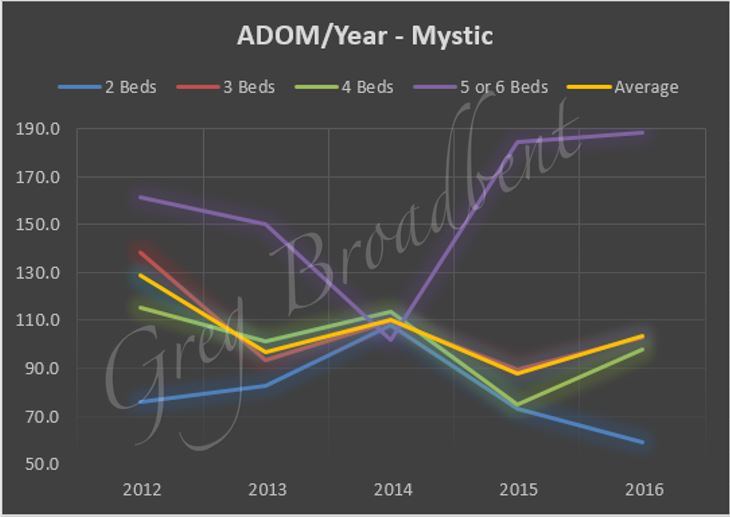
Finally, the chart below breaks down the averages per year for the number of days listings stayed active on the market for homes by number of bedrooms over the same period. This suggests that the longer listing periods are associated with 5-6 bedroom homes.
We’ll be monitoring the market over the coming months to see if there are other trends or data of interest which we can share with you in future blogs.
The metrics reported above were based on data obtained from the CTMLS as of January 3rd 2017. Updated information is available from our Mystic Real Estate Page.
If you are looking for homes for sale in Mystic or if you would like to work with a CT Realtor in the area, please contact us today. We look forward to helping you find just the right home for you.

