
There are presently 125 homes actively listed by Real Estate Agents in Ledyard which includes 77 homes in Gales Ferry. The average home on the market has a little less than 2000 square feet and 2 full bathrooms, between 3 and 4 bedrooms, and a little more than half the homes actively listed have at least one half-bathroom. The average number of “Active Days on the Market” (ADOM) is about 4 months.
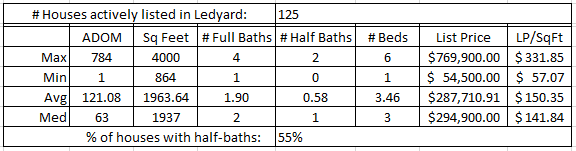
The data for Gales Ferry specifically are very similar to those shown above for Ledyard, except the homes are a little smaller – about 1885 square feet as the average and the median for square feet is 1728.
There are also 58 houses under deposit in Ledyard as shown in the chart below which includes 32 in Gales Ferry. As before, the data specifically for Gales Ferry are not much different from Ledyard generally.
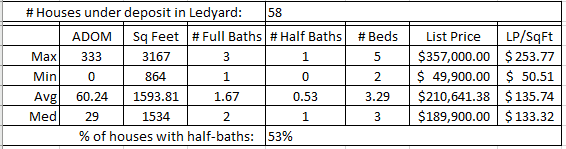
The data in the chart suggests that the homes under deposit are somewhat smaller than those presently on the market, since the average number of bedrooms, bathrooms, and living area are smaller than those which are on the market.
Also, the “Active Days on the Market” (ADOM) for houses under deposit averages approximately 2 months.
Looking over a longer term, demand for homes in Ledyard has grown over the past 5 years, both in Ledyard generally and Gales Ferry specifically.
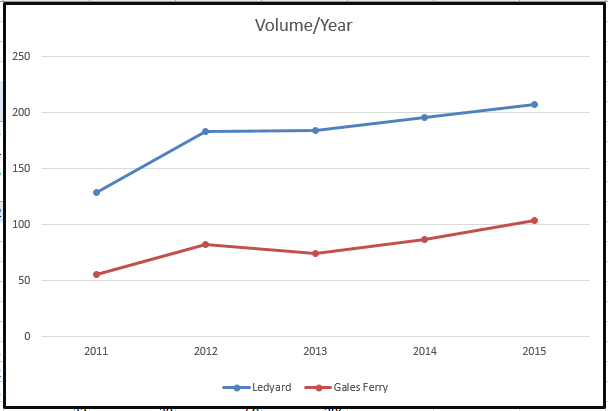
As the chart shows, the number of homes sold by Realtors in Ledyard was up about 60%, from 129 in 2011 to 207 in 2016. The number of houses sold in Gales Ferry has almost doubled from 56 to 104. Also, up through May 1st, 61 homes had sold in Ledyard in 2016 of which 27 were from Gales Ferry.
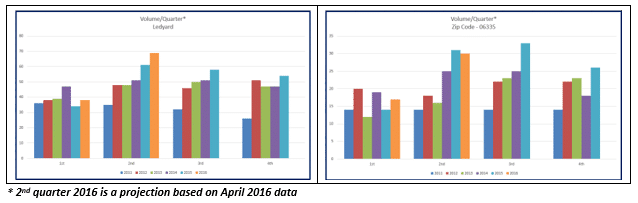
As shown in the charts below, the growth in the number of houses sold has been especially strong in 2nd and 3rd quarters. The number of houses sold has grown* each 2nd and 3rd quarter since 2011, and with two exceptions, it has grown in the 1st and 4th quarters as well.
As one might expect, the best prices can be expected with a summer closing, and the chart to the left below bears that out. The average price at closing from 2011 through 2015 was highest from May through August, although November and December are the next best months.
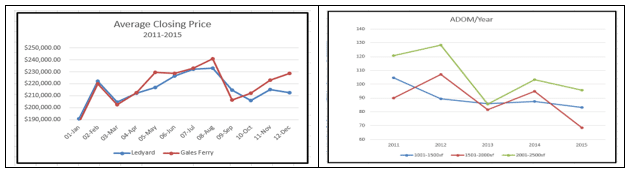
Finally, there is especially good news for those with houses in the range of 1000 to 2500 square feet since the number of days in which homes of that size remain active on the market is trending down. This is consistent with the difference seen above between the homes on the market and those under deposit.
There does seem to be some positives in the Ledyard market as seen in the increasing demand for homes, especially smaller homes, in the Ledyard area. We’ll be monitoring the market over the coming months to see if we can find other improvements and positive trends which we can share with you.
The statistics above was based on data from the CTMLS as of 6/1/2016. You can find updated information on our Ledyard Real Estate page. If you are looking for properties for sale in Ledyard or if you would like to work with a CT Realtor in this area, please contact us today. We would love to help you buy or sell your next home.

