
Summary
In summary, local Realtors had 139 homes listed for sale in all of Groton as of April 3rd. This area includes the Groton side of Mystic River, Noank, Mumford Cove, and Groton Long Point. The 139 homes are 19 more than the 120 homes which were actively listed on March 1st. Of these 139 properties, 84 were actively listed a month ago on March 1st as well. 46 of the 139 were also actively listed 3 months ago on January 3rd. In addition, local real estate agents had 41 homes under deposit as of April 3rd. There were 27 homes under deposit on March 1st. Finally, there were 21 closings and 46 new listings added for Groton to the CTMLS in March.
Active Listings
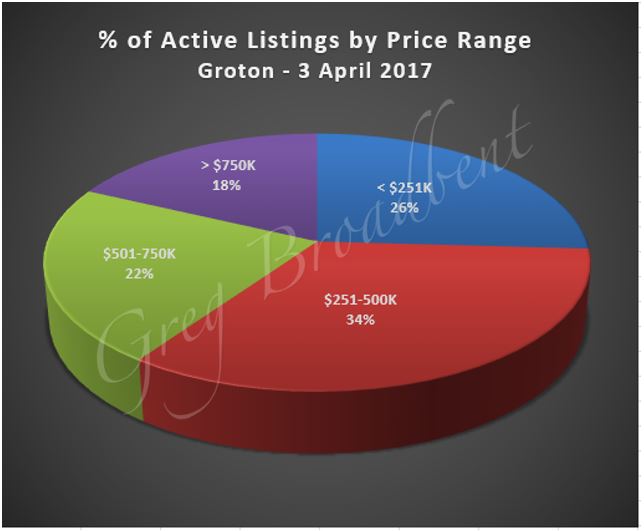
Listing prices ranged broadly from $85,000 to $3.2M for the homes actively listed on April 3rd. The average listing price was a little under $560,000. However, the median listing price of $425,000 was significantly lower. The chart below gives a percentage breakdown of homes listed in different price ranges across Groton.
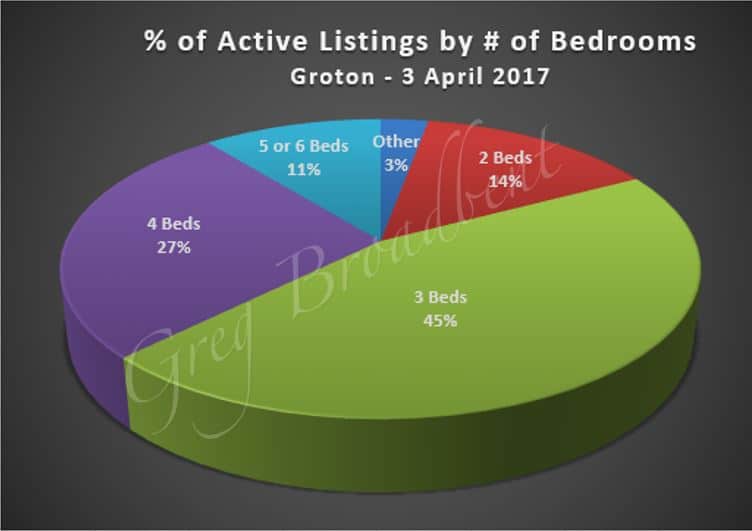
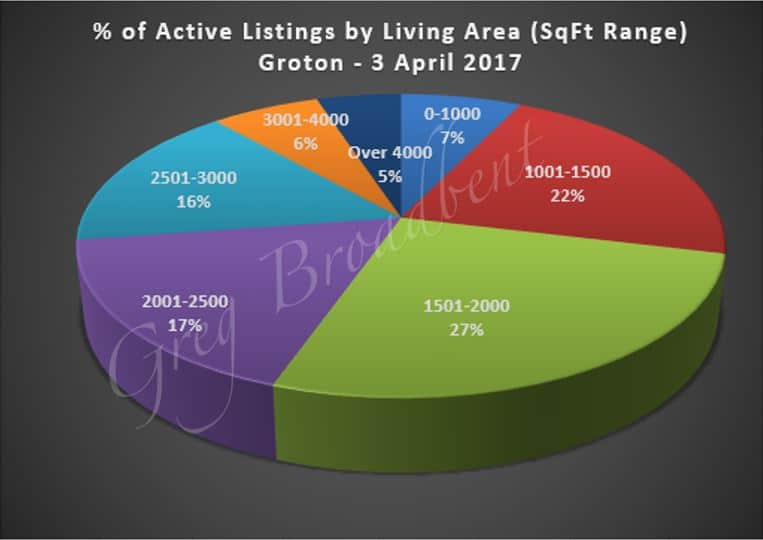
The average size for the 139 actively listed homes was just under 2100 square feet. The median living area was 1850 square feet for homes ranging in size from just over 500 to just over 7800 square feet. They offered from 0 to 9 bedrooms with 3.4 as the average. They included from 0 to 9 full bathrooms with the average at 2.1 full bathrooms. In addition, 70 (~50%) of these homes also had one, two, or three half-bathrooms. The following charts provide some supplementary information about the attributes of the actively-listed homes.
|
|
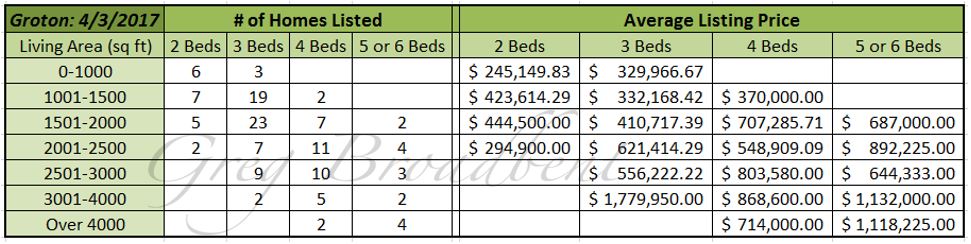
The chart below gives more detail relating living area (square feet) and number of bedrooms (for homes with 2-6 bedrooms) to the listing price showing the number of homes by, and the average listing price for, each combination of attributes for homes with active listings as of April 3rd.
Recent Activity
There were 41 homes under deposit as of April 3rd. This is 14 more than were under deposit a month ago on March 1st. The average listing price for these homes was just under $285,000. Prices for these homes were in a range from almost $83,000 to almost $950,000. Also, the average size for these homes was just over 1700 square feet with 3.3 bedrooms and 1.8 full bathrooms. Additionally, 17 (~41%) of these homes included one or two half-bathrooms. Finally, the listings for these homes had been active for an average of 85 days, not quite 3 months. There was a much lower median value of 26 days for this measure.
Sales closed for 21 homes in Groton last month in March, which was 2 more than closed in February. The average closing price for these 21 homes was a little over $292,000. At just under $180,000, the median closing price was much lower. The average size for these homes was about 1550 square feet with an average of 3 bedrooms and 1¾ full bathrooms. The listings for these homes had been active for an average of 115 days, or almost 4 months.
Past Closings
In comparison, 71 Groton homes had closings in the 1st quarter of 2017 – including March. The closing prices for these homes were in a range from $37,000 to $1.3M. The average closing price was a little more than $285,000 but $220,000 was the median closing price. These homes offered between 2 and 6 bedrooms with an average at 3.2 bedrooms. In addition, they included between 1 and 3 full bathrooms with 1.7 as the average. Also, 23 (~32%) of these homes had one or two half-bathrooms as well. These listings were active for an average of 107 days – about 3½ months. But the median period was 71 days – a bit over 2 months.
For additional comparison, there were closings for 73 homes in Groton for the 1st quarter of 2016. Closing prices also ranged broadly from $35,000 to just over $1.2M. The average and median closing prices were a little lower at almost $250,000 and $205,000 respectively. There were between 1 and 5 bedrooms in these homes which had an average of 3.1 bedrooms. In addition, these homes included between 1 and 4 full bathrooms with an average of 1.8 full bathrooms. 25 (~34%) of them offered one or two half-bathrooms as well. Finally, these listings had been active for an average of 106 days – about 3½ months again. The median period was not significantly lower in this case – only 94 days.
Longer-Term Review
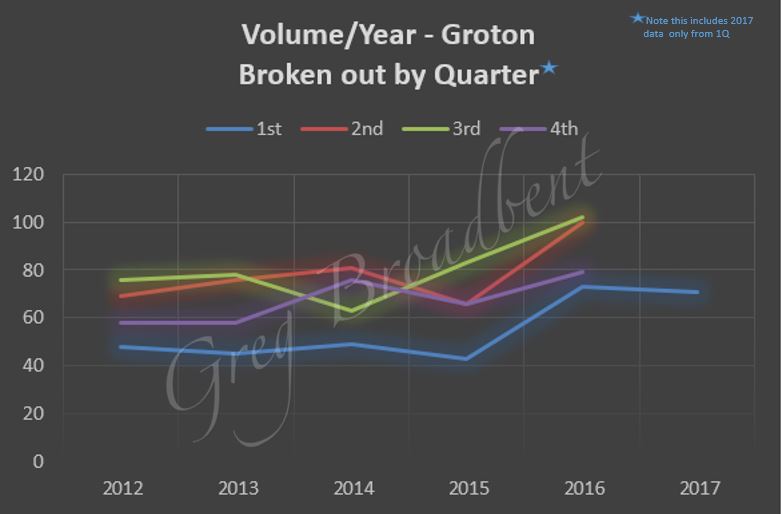
As far as longer term trends go, the chart below shows the number of homes sold per quarter since 1Q2012. This shows that there were increases in all quarters for 2016. It shows that the 1st quarter of 2017 is roughly tracking with the corresponding quarter in 2016. Also note how much better the volume is for 1Q2016 and 1Q2017 relative to the first quarters of the preceding years.
The chart below shows a 12-month quarterly “rolling average” for closing prices for homes with 2, 3, 4, and 5-6 bedrooms as well as an overall average over the past 5 years. It suggests that the overall average closing price has been more or less holding steady over the period. Also, prices for 3 bedroom homes seem to have been fairly steady as well. Prices for 2 bedroom homes seem to have recovered after a dip over the past 6 quarters. While prices seem to have been declining for homes with 5-6 bedrooms, prices for 4 bedroom homes seem to have improved over the preceding 4 years.

The background bars in blue show a 12-month quarterly “rolling average” for the number of days listings stayed active on the market for the same period. This suggests that the amount of time a listing remains active has been declining since 2012. It seems that homes are selling faster now than at any time in the preceding 5 years.
Finally, the chart below provides another perspective on closing prices. It shows the average closing price after being divided by SQUARE FEET of living area broken down by number of bedrooms as well.
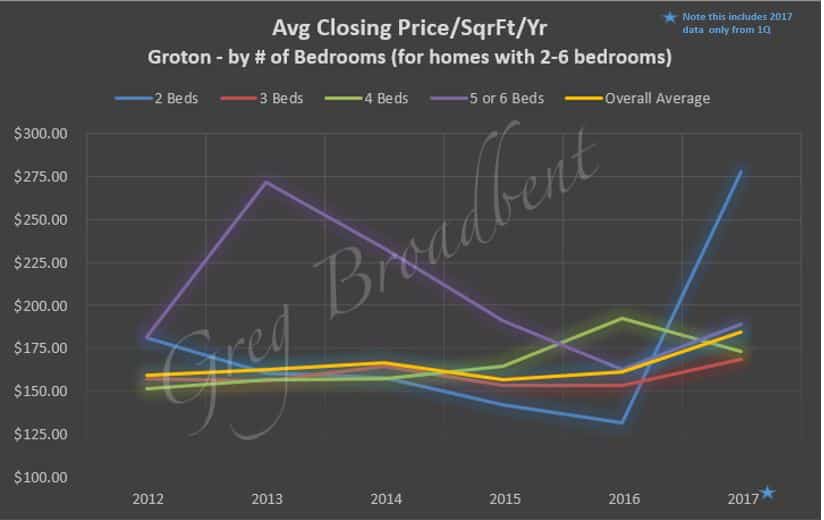
While the spike for the 2 bedroom homes in 1Q2017 is probably an anomaly, the overall trend seems to be that the price per square foot is slowly improving.
Conclusion
We will continue to monitor the market for other trends or data of interest which we can share with you. We will post any updates to our Groton Real Estate Page.
The data reported above was based on data obtained from the CTMLS as of April 3rd 2017. If you are looking for a home in the Groton area or if you would like to work with a local Realtor, please feel free to call us. We look forward to helping you find your next home.

