
There were 46 homes listed for sale in Pawcatuck by real estate agents as of July 1st; that is one more than was listed on the 1st of the preceding month. Of these 46, 33 were also listed as of June 1st, meaning that 13 listings were added for the Pawcatuck area in June.
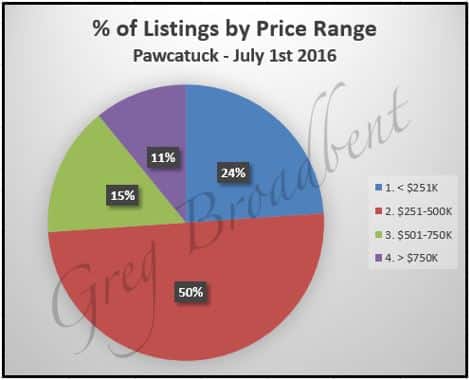
The average listing price for these 46 homes was a little under $636,000 with prices ranging from $145,800 to $8,900,000 and $412,000 as the median value. The chart below gives a percentage breakdown of homes in different price ranges currently listed for sale in Pawcatuck.
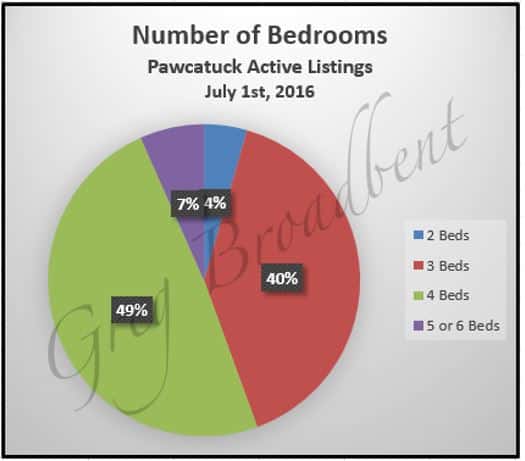
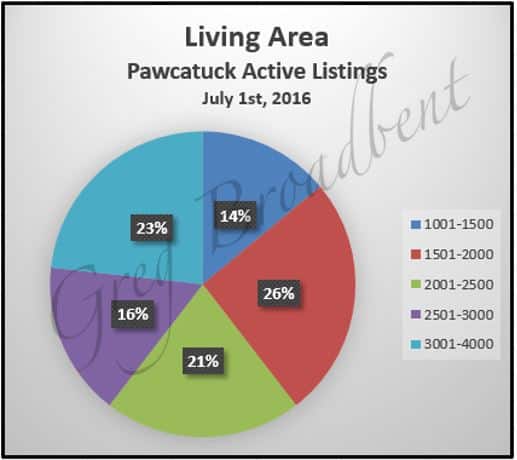
The size of the average house listed for sale in the greater Pawcatuck area was just over 2525 square feet with 3.7 bedrooms and a little over 2 full bathrooms; 29 of these 46 homes have at least one half-bathroom. The charts below provide some additional detail about the percentages of homes listed by number of bedrooms and range of living area size.
There were 9 homes under deposit in Pawcatuck on July 1st, down 6 from the 15 which were listed as under deposit as of June 1st. The average price for these 9 homes was a little under $241,000 and ranged in price from $105,000 to $499,000 with the median price at at $225,000.
These homes had an average size of just over 1600 square feet with 1.6 full bathrooms and just 2.8 bedrooms. On the average, the homes under deposit as of July 1st were active on the market for less than 2 months at 50 days, but the median ADOM (“Active Days on Market”) for these homes was only 15 days.
There were closings on 9 homes last month in June. These 9 homes had an average closing price around $255,000 with prices in the range of $130,000 to $468,500 and $215,000 as the median price value. These homes had on the average of about 1550 square feet of living area, with just under 3 bedrooms and just under 2 full bathrooms These homes had been on the market for an average of 54 days, under 2 months, but the median ADOM value was 39 days.
For comparison, there were also closings for 9 homes in June of 2015. These homes had an average closing price of $237,500 for an 1800 square foot home with just over 3 bedrooms. These homes had been on the market for an average of 113 days, just over 3.5 months.
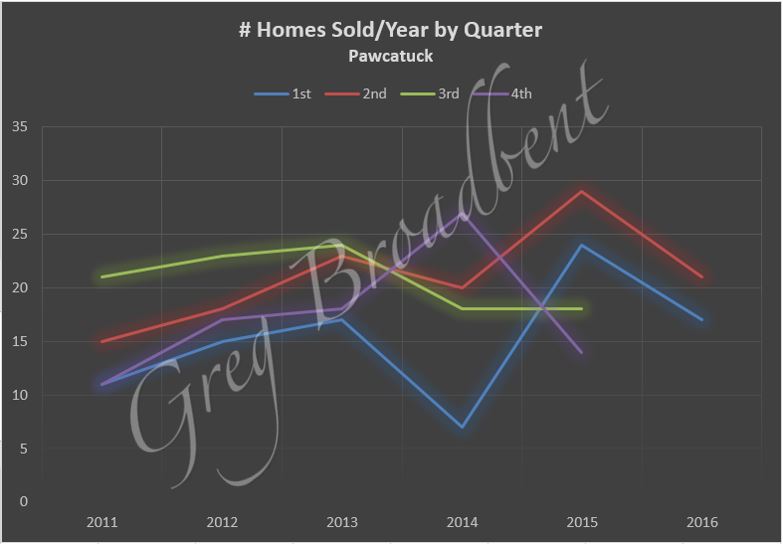
As far as longer term trends go, the graph below shows the number of homes sold by real estate agents broken out by quarter since the 1st quarter of 2011. Although the trend suggested increases for all quarters from 2011 through 2013, the pattern was broken in 2014 and has been erratic since then.
The chart below provides some information on trends in closing prices. It shows a “rolling” 4-quarter average for closing prices for homes sold per quarter over the past 5 years in total and broken down by number of bedrooms (for homes having 2-6 bedrooms). This suggests that prices have come down a bit since 2012 and have remained generally flat since then, except for a bit of a recovery for homes with 4 bedrooms.
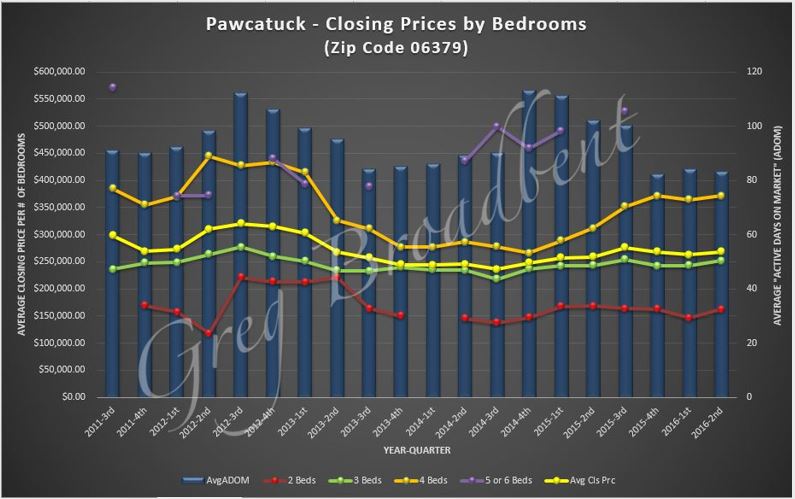
The chart above also shows a 12-month rolling average for “Active Days on Market” regardless of number of bedrooms. This suggests that the average time to sell a home has had a bit of a roller-coaster ride with peaks late in 2012 and 2014. However, this graph also suggests that homes are selling faster now than in any period since the beginning of 20111.
We’ll be monitoring the market over the coming months to see if there are other trends or data of interest which we can share with you in future blogs.
The data reported above was taken from the CTMLS as of July 1st 2016 for single family homes. Updated information will be posted on our Pawcatuck Real Estate Page. If you are looking for a home in Pawcatuck or if you would like to work with a local CT Realtor, please feel free to call us. We would love to help you buy or sell your next home.

