
8 homes were listed for sale on Masons Island by local Realtors as of August 1st. This was the same number of homes as were listed on July 1st. 5 of these listings were also active on July 1st, and 3 new listings were added in July.
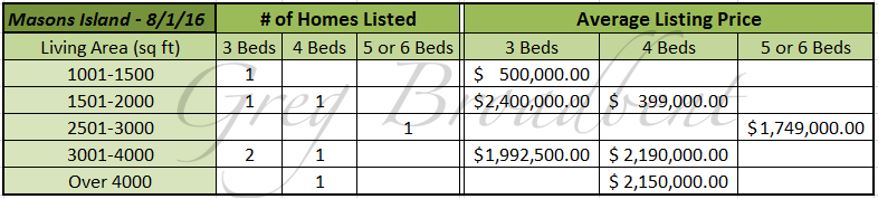
The average listing price for the 8 homes listed was a little over $1,670,000 with prices in the range $399,000 to $2,400,000. The median price for these 8 homes was about $1,950,000. The average size of these homes was close to 2875 square feet with 3-4 bedrooms and close to 3 full bathrooms; 1 of these 8 homes had a half-bathroom as well.
The chart below provides some additional detail relating the number of bedrooms and range of living area sizes to the listing price.
There were 3 homes under deposit as of August 1st ranging widely in price from $350,000 to $4,790.000; these homes were “Active on the Market” for an average of 96 days.
There were closing transactions for 42 homes between January of 2011 and July of 2016. The last closing occurred last month in July on a 2200 square foot, 3 bedroom, 2.5 bath home which had been listed for 415 days.
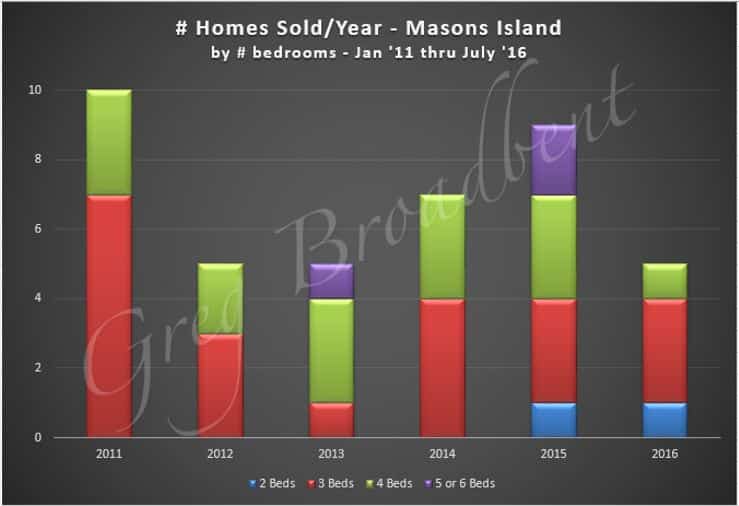
The chart below breaks down the number of homes sold each year by the number of bedrooms in the home (for homes with 2-6 bedrooms). This suggests that the volume could continue to increase as it seems to have since 2013 (noting that we’re only 7 months into 2016 at the time of this writing).
Finally, the chart below provides some information on trends in closing prices. It includes a “rolling average” for closing prices of homes sold per quarter over the past 5 years in total. It also shows a “rolling average” for closing prices broken down by number of bedrooms (for homes having 2-6 bedrooms). Although the average closing price in the chart below seems to be trending lower recently, also note that in the chart above, the sizes of the houses being sold in the last couple of years tend to be smaller (or at least have fewer bedrooms).
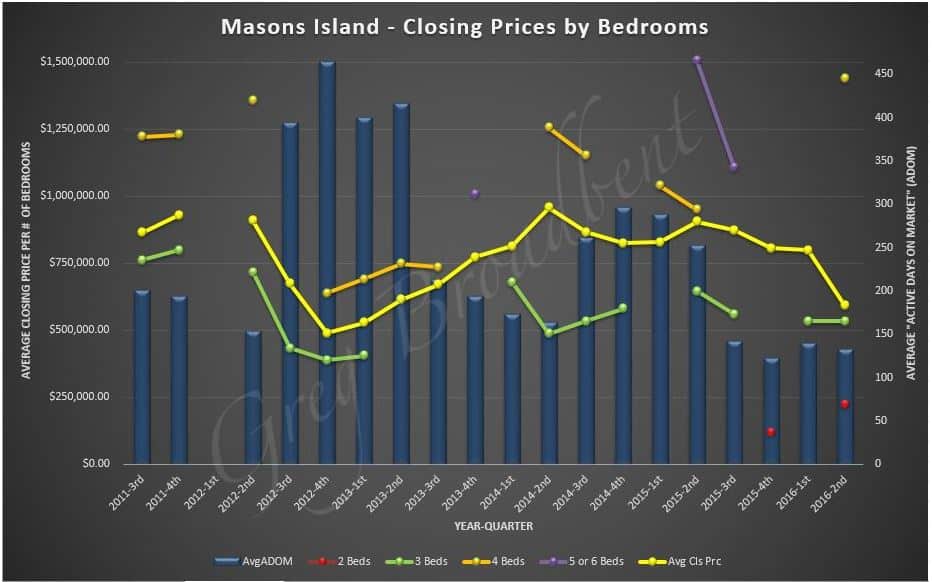
The chart above also shows a 12-month rolling average for “Active Days on Market” for all homes, disregarding number of bedrooms. This data suggests that listed homes sell as quickly now as they have any time in the past 5 years, which is good news for sellers.
We’ll be monitoring the market over the coming months to see if there are other trends or data of interest which we can share with you. We will post these to our Masons Island Real Estate and Information page.
The trends reported above were based on data obtained from the CTMLS as of August 1st 2016 for single family home properties. If you are considering purchasing a home on Masons Island or if you would like to work with a Realtor in the area, please feel free to call us. We would love to help you buy or sell your next home.

