
Local real estate agents had 162 homes listed for sale in the Stonington area as of September 1st; this is 6 more than the 156 that were actively listed as of August 1st. Of the 162 homes listed on September 1st, 125 were also listed August 1st and 52 of these were actively listed 3 months earlier on June 1st as well.
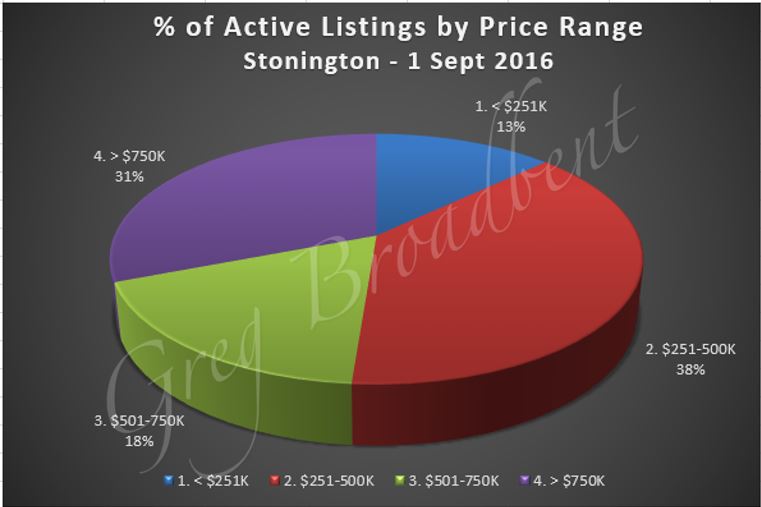
Prices covered a wide range from $84,000 to $7,900,000. The average listing price was a little over $830,000 but had a much lower median listing price of $499,000. The chart below gives a percentage breakdown of homes in different price ranges currently listed for sale in Stonington.
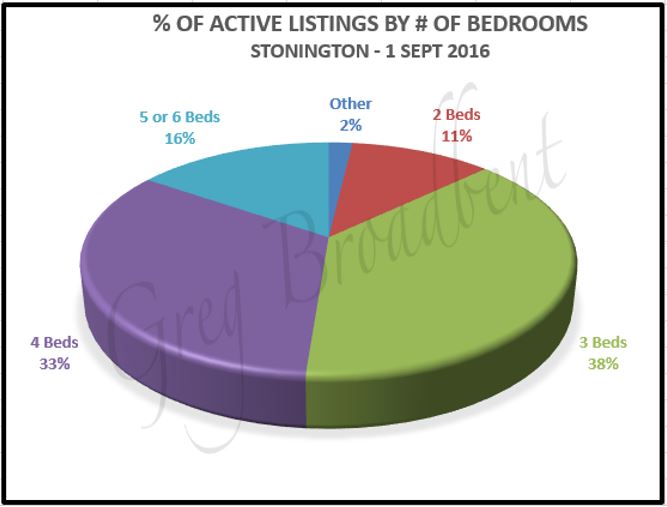
The size of the average house listed for sale in the Stonington area was a little over 2700 square feet with homes in the range of 720 to over 7800 square feet. Homes offered from 1 to 8 bedrooms with 3.6 being the average and 3.5 being the median number of bedrooms. There were also from 1 to 8 full bathrooms with 2.7 being the average number of full bathrooms and 2 being the median. 95 of these 162 homes had at least one half-bathroom as well.
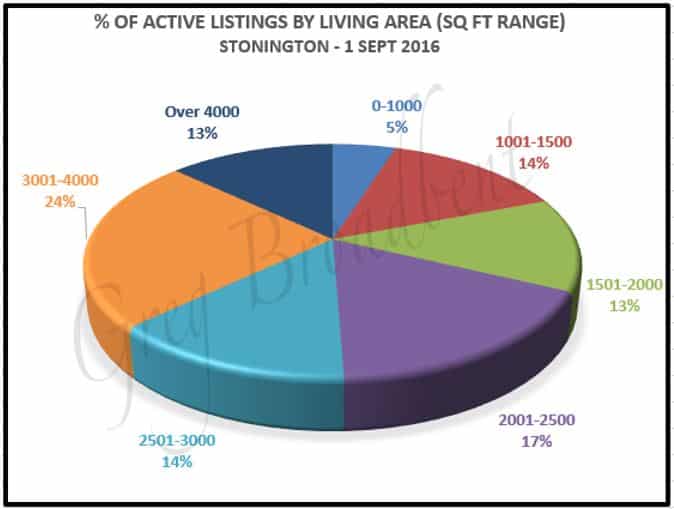
The following charts provide some additional detail about how many houses have different numbers of bedrooms and ranges of living areas.
|
|
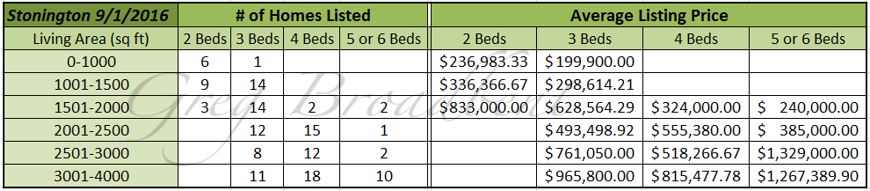
To complete the review of active listings, the chart below provides some additional detail about the number of homes listed by number of bedrooms and ranges of living area size, as well as the corresponding average listing price.
There were 15 homes under deposit in Stonington as of September 1st, down 7 from the 22 which were under deposit on August 1st. The average price for these 15 homes was just over $680,000 and ranged in price from $145,800 to $2,190,000 with $425,000 being the median price. Listing price/square foot averaged around $285 with the median price per square foot being $200.
The 15 homes under deposit as of September 1st had an average size of just over 2200 square feet with an average of 3.5 bedrooms and 2.5 full bathrooms, although the medians were 3 and 2 respectively. On average, the homes under deposit were active on the market for almost 7 months at 209 days although the median value for number of active days on the market was a much lower 84 days, a little less than 2 months.
There were closing transactions for 17 homes in Stonington in August. The closing price averaged a little under $330,000 although the median was much lower at almost $232,000. The homes averaged about 1830 square feet in size with an average of 2.9 bedrooms and 1.7 full baths. On average, the homes were active on the market for almost 3.5 months at 103 days although the median value was much lower at 43 days.
For further comparison, there were closings for 17 homes a year ago in August of 2015 as well. These homes had an average closing price of just over $487,000 and a median price of $320,000. The average size was under 2100 square feet and had an average of 3.3 bedrooms and just under 2 full baths. The homes averaged 92 active days on the market but the median value for this metric was much lower at 18 days.
There have been closing transactions for 133 homes as of September 1st. Thus far in 2016, the average home has sold for an average of about $368,500, and $300,00 was the median price. The average size of these homes was about 2015 square feet, although the median size was about 200 square feet larger at 1820. These homes had an average of 3.2 bedrooms and 2 full bathrooms. On average, the homes were active on the market for almost 4 months at 117 days although the median value was lower at 67 days.
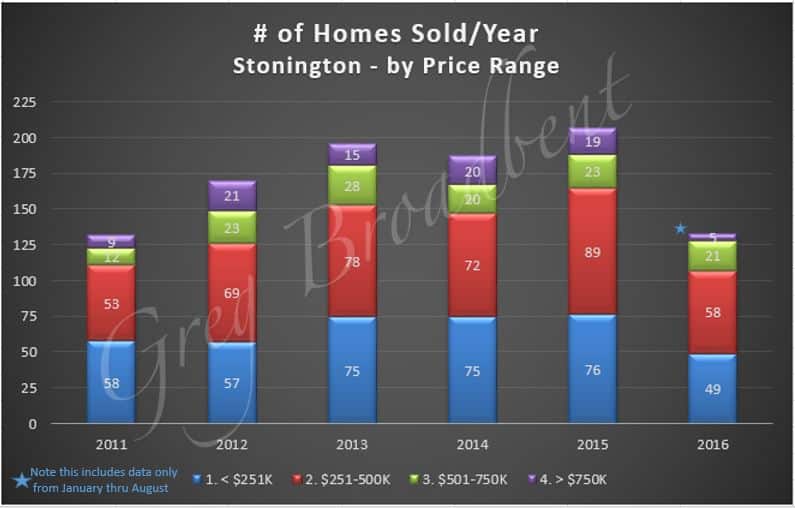
As far as longer term trends go, the graph below shows the number of homes sold per year since 2011 both in total and broken down by number of bedrooms (for homes having 2-6 bedrooms), noting that the 2016 metric reflects only partial data for the year. The number of homes sold per year from 2011 through 2015 did seem to be trending in a positive direction, even with the slight decline in 2014.
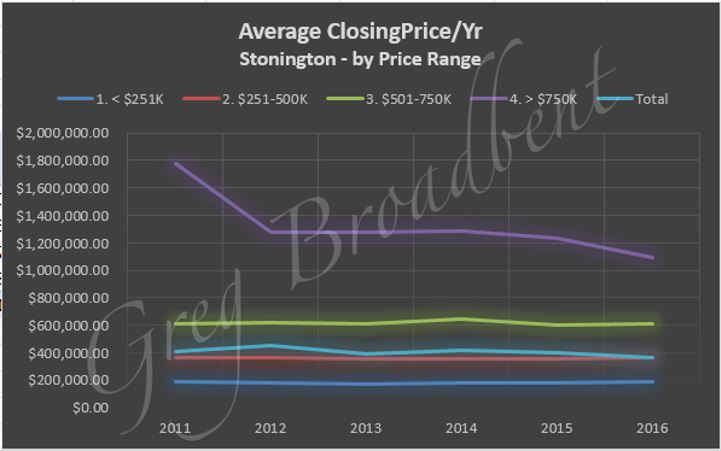
As the next chart suggests, average closing prices in 3 of the 4 price ranges, and the overall total average closing price, has held more or less steady since 2011 (noting again that the 2016 data includes only the months of January through August).
We’ll continue to watch the residential property market and bring you additional observations and data in future blogs.
The trends reported above were based on data obtained from the CTMLS as of September 1st 2016 for single family residential properties. We will post updated information on our Stonington Real Estate Page. If you are considering purchasing a home in Stonington or would like to work with a Realtor in the area, please feel free to call us. We look forward to helping you find just the right home for you.

