Summary
The summary for the real estate market activity for homes in Mumford Cove starts by noting that Realtors had 2 homes actively listed for sale as of June 1st. There was no change in the number of active listings from the previous month. 1 of these 2 homes was also actively listed a month ago on May 1st. 1 of these same listings was active three months ago on March 1st as well. In addition, a sales transaction closed for 1 home and 1 home went under deposit in May. Finally, real estate agents added 1 new listing to the CTMLS in May for Mumford Cove.
Recent Activity
1 of the 2 homes listed on June 1st was an approximately 3900 square foot home with 4 bedrooms and 3 and ½ bathrooms. This home was active for 17 days as of June 1st and was listed for $839,000. The other home offered over 5000 square feet of living area. In addition, it included 6 bedrooms and 5 full bathrooms. Also, it was active on the market for 94 days as of June 1st. The asking price was $849,000.
There was one home under deposit as of June 1st. It offered 3 bedrooms and 2 full bathrooms with about 1925 square feet of living area. It was actively listed for about 110 days and listed at $465,000.
Past Activity
There were closings for 3 homes in Mumford Cove in 2017 through June 1st so far: 2 in March and 1 in May. These homes averaged over 2700 square feet of living area. 2 of the homes offered 3 bedrooms and 1 home had 6. In addition, 2 of the homes included 3 full bathrooms and 1 home had 2 full bathrooms. 2 of the 3 included a single half-bathroom as well. Their corresponding listings were active for an average of about 170 days. Finally, the average closing price was $785,000.
For comparison, sales transactions closed for only 3 homes during all of 2016. These homes averaged a smaller living area at about 2100 square feet. Also, each house offered a different number of bedrooms: the first had 3 bedrooms, the second had 4, and the third had 5 bedrooms. As in 2017, 2 of the homes included 3 full bathrooms and 1 home had 2 full bathrooms, and 2 of the 3 included a single half-bathroom. However, their corresponding listings were active for a shorter average of 67 days. Finally, the average closing price was lower than that for 2017 at a little under $525,000.
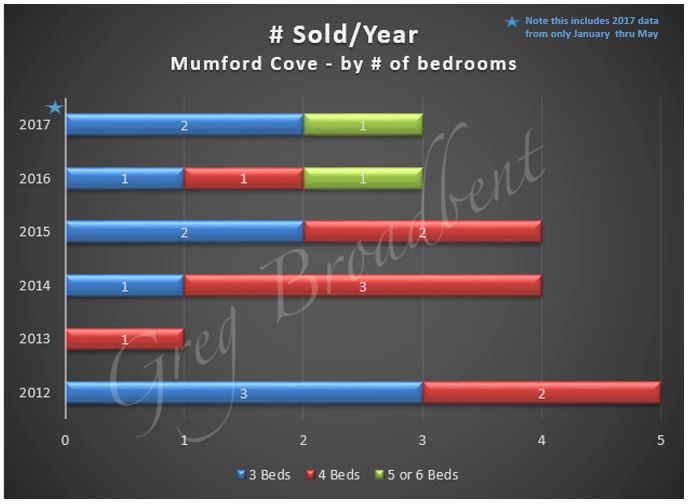
As far as longer term trends go, the chart below shows the number of homes sold in Mumford Cove by year and number of bedrooms (for homes with 2-6 bedrooms). Note that 2017 has only January through May data. This could be encouraging since 2017 would be the best of the past 6 years if this pace was maintained for the whole year.
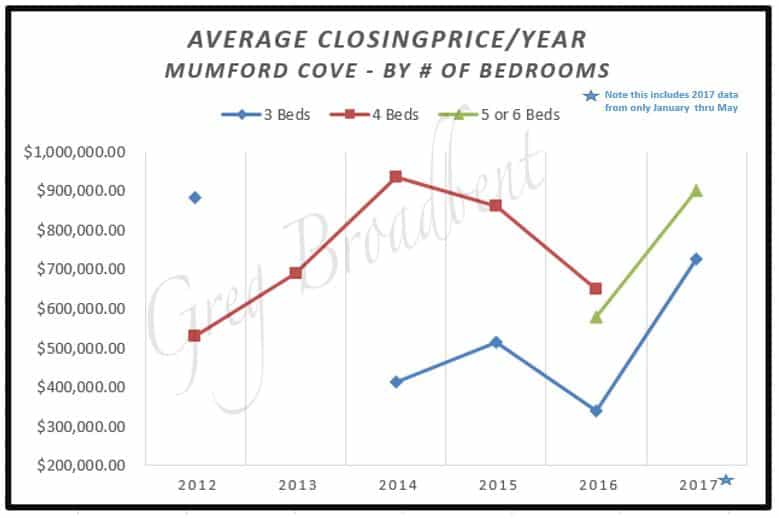
The following chart shows average closing prices using the same stratification as in the chart above. Note that averages are based on a limited number of data points as indicated in the chart above.
Conclusion
We’ll continue to watch the residential property market and bring you additional observations and data in future blogs.
We based the trends reported above on data obtained from the CTMLS as of June 1st 2017 for single family residential properties. We will post updated information on our Mumford Cove Real Estate Page. If you are considering purchasing a home in Mumford Cove or if you would like to work with a Realtor in the area, please feel free to call us. We look forward to helping you find just the right home for you.


