As of September 1st, there were 34 single family properties listed for sale in Groton Long Point by local real estate agents on the CTMLS, 2 fewer than the 36 that were listed on August 1st. 30 of these 34 homes were listed on August 1st also, and 11 of these 34 were actively listed 3 months ago on June 1st as well. 4 new listings were added in August.
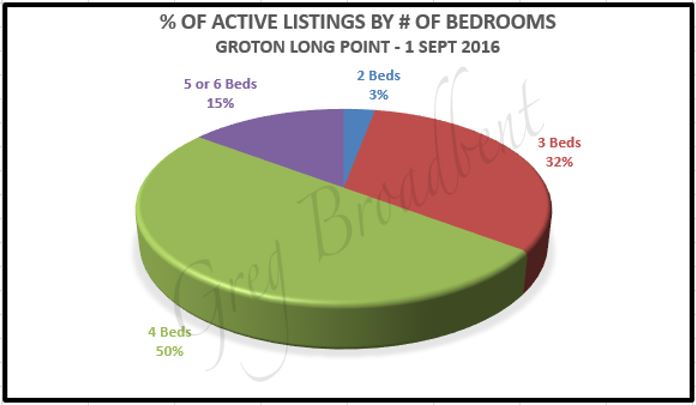
The average size of the 34 homes listed is just over 2325 square feet and the sizes range from a little over 1150 square feet to a little under 5000 square feet. The average number of bedrooms is 3.8, and 2.25 is the average number of full bathrooms. 22 of these homes had at least one half-bathroom. The charts below provide a bit more detail about the numbers of bedrooms and living areas of the homes on the market in Groton Long Point.
|
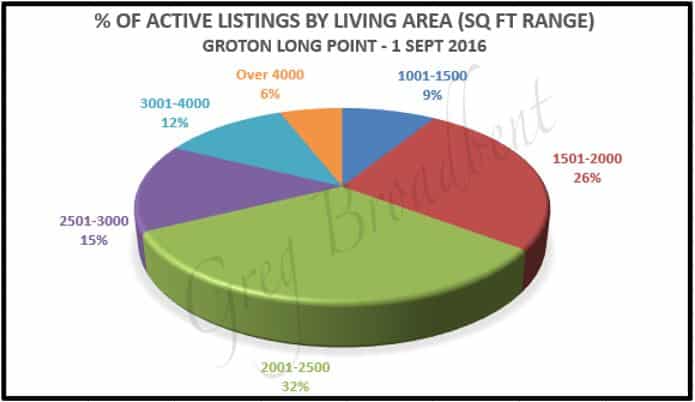
|
The asking prices of the 34 homes listed ranged from $399,000 to $3,200,000 with $1,082,500 as the median asking price and the average asking price a little under $1,185,000. The following chart shows how the average listing price varies with number of bedrooms and living area, and shows the number of houses listed in each category.
5 homes were under deposit in Groton Long Point as of September 1st. The average list price for these homes was about $1,215,000 with prices being in the range $645,000 to $1,690,000. These 5 homes were on the market an average of about 200 days. They were active for between 164 and 320 days.
There were closings for 3 homes during August, bringing the total number of closings for 2016 as of September 1st to 11. The average size for these 11 homes was about 2250 square feet with the sizes ranging from 1200 to 4465 square feet and an average of 3.7 bedrooms. The average closing price was a little over $960,000 with closing prices in the range of $415,000 to $2,100,000. The listings for these homes were active between 24 and 609 days with the average listing being active for 150 days and the median being 105 days.
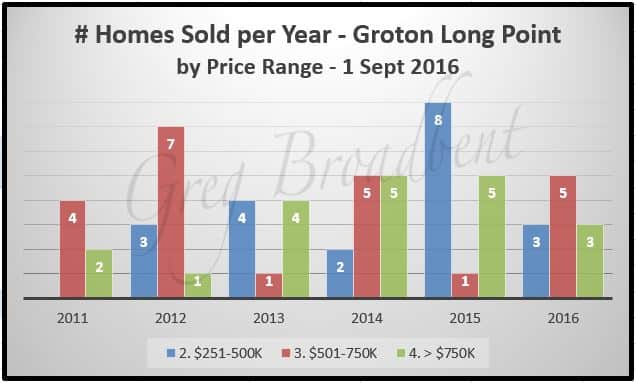
Looking at the data over the longer term, the following chart shows the number of homes sold in Groton Long Point since January 2011 broken down by price range of the home and year of the closing. Note that the 2016 values include data only from January through the end of August “Year-to Date” (YTD).
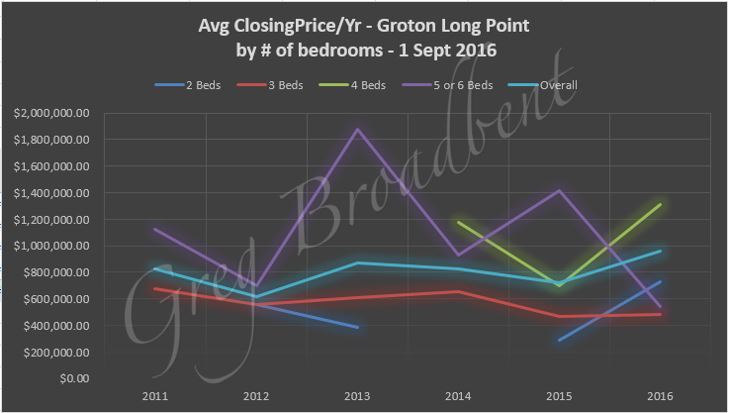
Continuing with data over the longer term, the following chart displays an average closing price per year since 2011 for homes by number of bedrooms as well as an overall average. Note again that the 2016 values only include data from January through August.
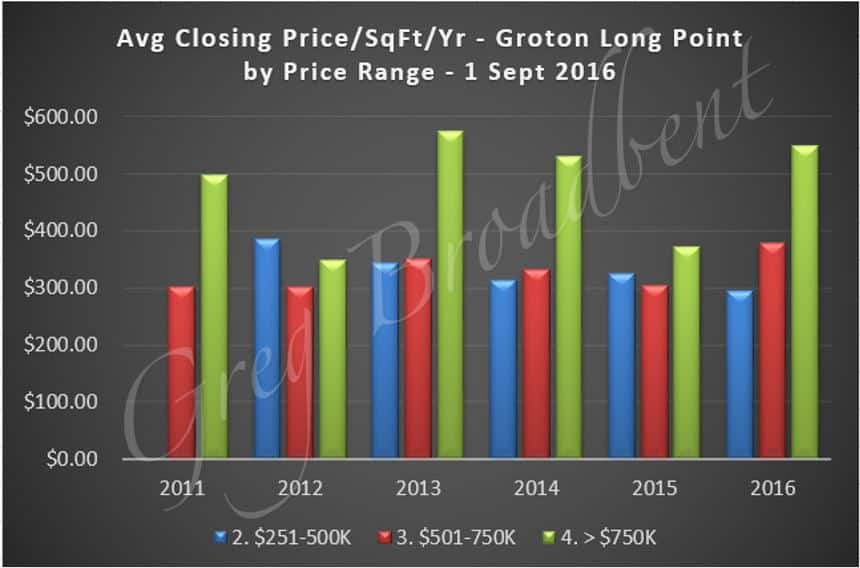
Finally, here’s one additional view of closing prices over the same period showing the average closing price for homes in different price ranges after dividing the closing price for each homes by the corresponding SQUARE FEET of living area. Please note again that the 2016 values only include data from January through August.
We’ll continue to watch the residential property market in the local area and bring you additional observations and data in future blogs.
The data reported above was taken from the CTMLS as of September 1st 2016 for single family homes. Updates will be posted to our Groton Long Point page.
If you are looking for residential properties for sale in Groton Long Point or if you would like to work with a Realtor in this area, please contact us today. We would love to help you buy or sell your next home.


