
There were 153 homes listed for sale by real estate agents in the Stonington area as of July 1st, up 2 from the 151 that were actively listed as of June 1st. Of the 153 homes listed on July 1st, 118 were also listed on June 1st indicating that 35 new listings were added during the month of June.
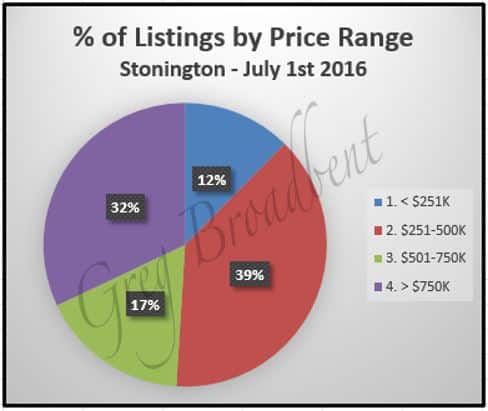
The average listing price was about $870,000; prices ranged from $145,800 to $8,900,000 with $499,000 as the median value. The chart below gives a percentage breakdown of homes in different price ranges currently listed for sale in Stonington.
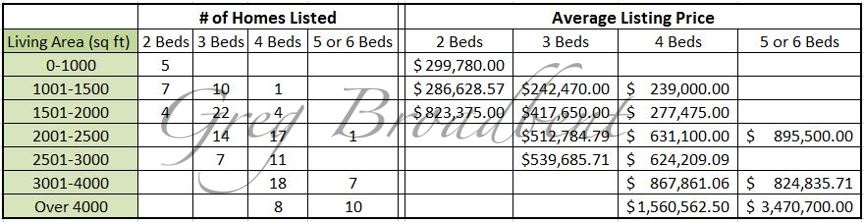
The size of the average house listed for sale in the Stonington area was a little under 2800 square feet with 3-4 bedrooms and 2-3 full bathrooms; 89 of these 153 homes have at least one half-bathroom. The chart below provides some additional detail about the number of homes listed by number of bedrooms and range of living area size, as well as the corresponding average listing price.
There were 17 homes under deposit in Stonington as July 1st, down 27 from the 44 which were under deposit as of June 1st. The average price for these 17 homes under deposit on July 1st was just under $300,000 and ranged in price from $105,000 to $675,000 with the median price at about $280,000.
The homes under deposit as of July 1st had an average size of just under 1900 square feet with 1-2 bathrooms and just over 3 bedrooms. On average, the homes under deposit were active on the market for about 3 months, at 92 days.
There were closing transactions for 21 homes in Stonington in June. The averages for these 21 homes were very similar to those for the 17 under deposit with an average closing price also just under $300,000, prices in the range of $130,000 to $566,000 and $273,000 as the median value. These 21 homes had on average about 1750 square foot for living area, with just over 3 bedrooms and 1-2 full bathrooms. These homes had been on the market for an average of 57 days, just under two months.
For further comparison, there were closings for 28 homes a year ago in June of 2015. These homes had an average closing price of just over $410,000 for a 2200 square foot home on average with 3-4 bedrooms and just under 2 full bathrooms.
As far as longer term trends go, the graph below shows the number of homes sold per quarter over the past 5 years in total and broken down by number of bedrooms (for homes having 2-6 bedrooms). The trend lines in the chart show sales of 3 bedroom homes to be most numerous, followed by 4 bedrooms homes. Also, the volume of 3 and 4 bedroom homes seems to track the same generally, increasing and decreasing together where the sales of 2 and 5-6 bedroom homes have consistently less volume and track more independently of the 3 and 4 bedroom homes.
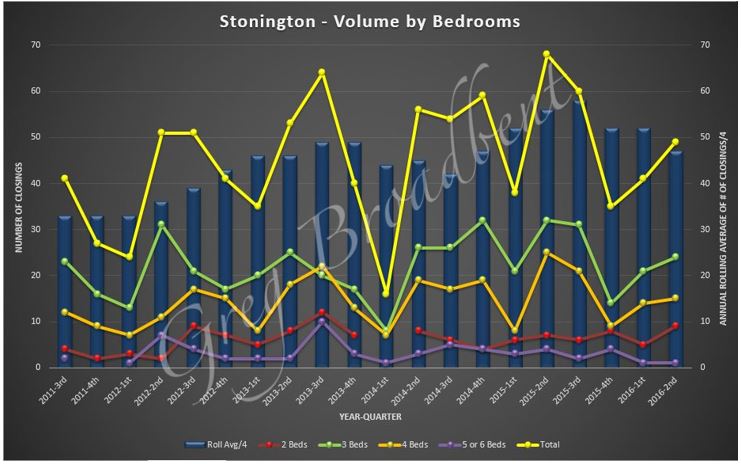
The chart above also shows a bar chart for a 12-month “rolling average” (averaging the number of closings for the given quarter and the 3 preceding quarters) for the number of closings for homes regardless of the number of bedrooms to give a less volatile trend indicator for numbers of closings.
The chart below provides a “rolling average” for closing prices for homes sold per quarter over the past 5 years in total and broken down by number of bedrooms (for homes having 2-6 bedrooms). This suggests that closing prices based on number of bedrooms have been flat for the most part except for 5-6 bedroom homes.
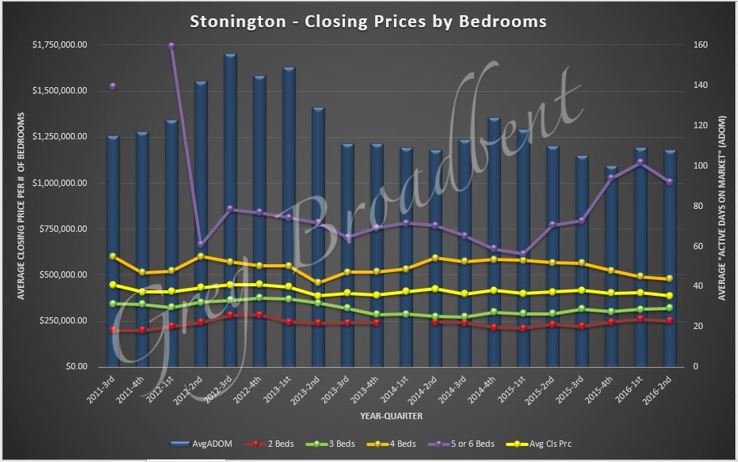
The chart above also shows a 12-month rolling average for “Active Days on Market” regardless of number of bedrooms. This suggests that the average time to sell a home has come down from around 5 months in 2012 to about 3.5 months more recently, and that would be a positive for sellers.
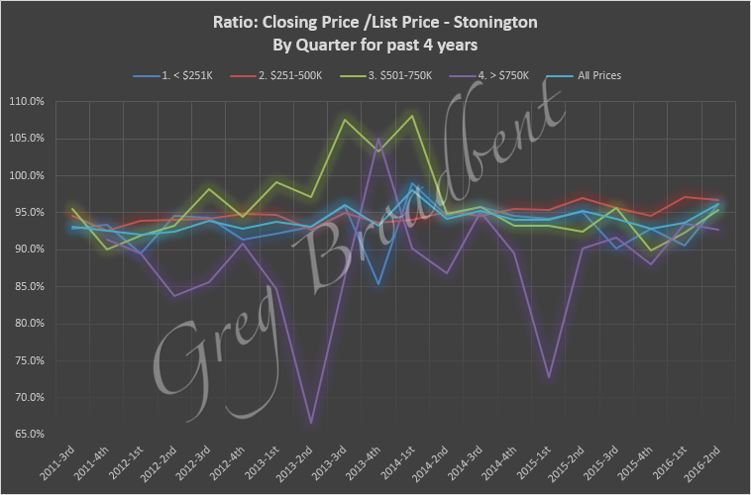
Finally, the chart below shows the average ratio of closing price divided by listing price expressed as a percent, an indicator of how much a seller actually gets of the actual listing (or asking) price. It shows that after relatively wide fluctuations over the last 5 years, there was some convergence within the last year, and after a slight dip, the percents could be trending back up.
We’ll continue to watch the residential property market and bring you additional observations and data in future blogs.
The trends reported above were based on data obtained from the CTMLS as of July 1st 2016 for single family residential properties. Updated information will be posted on our Stonington Real Estate Page. If you are considering purchasing a home in Stonington or if you would like to work with a CT Realtor in the area, please feel free to call us. We look forward to helping you find just the right home for you.

