
As a quick summary, local Realtors had 122 homes listed for sale in the Stonington area as of February 1st. Note that this includes the Stonington Borough, Masons Island, Lords Point, Pawcatuck, and the Stonington side of Mystic. Of these 122 listings, 100 were also active a month ago on January 3rd. 75 of them were active 3 months ago on November 1st as well. 6 homes were listed as under deposit on February 1st, down from the 9 that were under deposit on January 3rd. Finally, 21 new listings were added to the CTMLS in January – and there were closings for 12 homes.
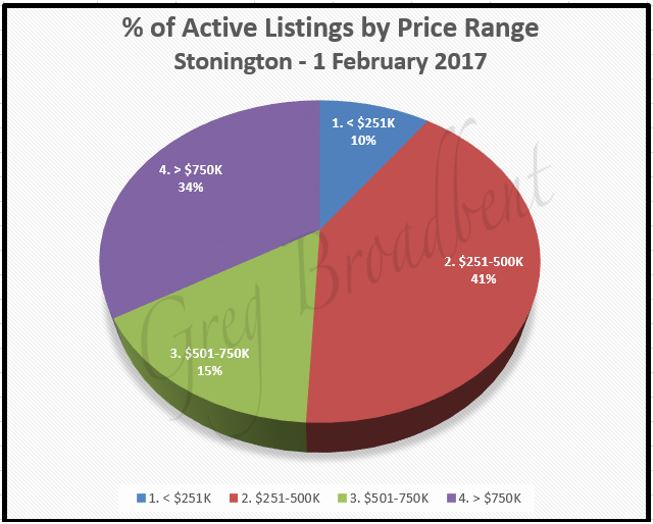
Prices covered a wide range for these active listings running from $125,000 to $6,750,000. The average listing price was around $895,000 but the median listing price was a much lower $500,000. The chart below gives a percentage breakdown of homes in different price ranges listed for sale in Stonington as of February 1st.
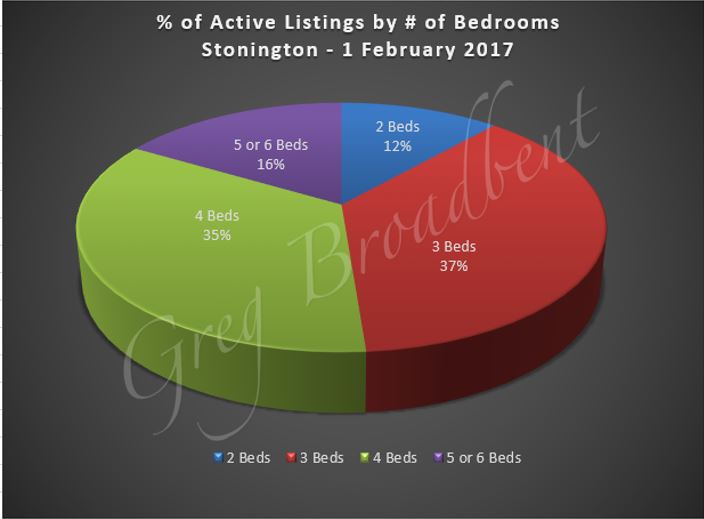
The size of the average house listed for sale in the Stonington area was a little over 2800 square feet. These homes varied widely in range from around 600 to over 7800 square feet. Homes had from 2 to 8 bedrooms with 3.6 being the average. Also, they had from 1 to 6 full bathrooms with 2.5 being the average. 70 (~57%) of these 122 homes had at least one half-bathroom as well.
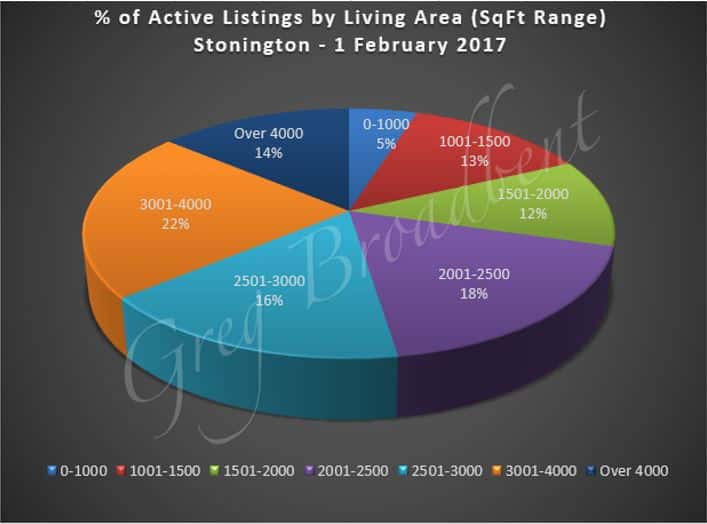
The following charts provide some additional perspective about the different number of bedrooms and ranges of living areas offered in these homes.
|
|
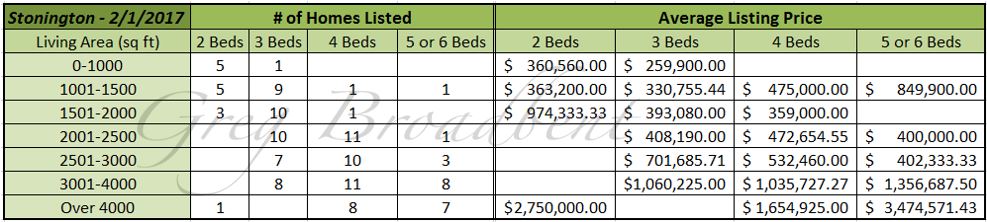
To complete the review of active listings, the chart below provides some additional detail. It shows the count of homes listed by number of bedrooms and range of living area size, as well as the corresponding average listing price for these homes.
There were 6 homes under deposit in Stonington as of February 1st. The average price for these homes was just over $290,000. They ranged in price from $169,000 to $439,000 with the median price at $264,500. These homes had an average size of around 2250 square feet with. They had an average of 2.8 bedrooms and 1.7 full bathrooms. On average, listings for the homes were active on the market for about a month at 29 days.
There were closing transactions for 12 homes in Stonington in January. The closing price averaged a little over $355,000 although the median was lower at $341,500. The homes averaged about 1900 square feet in size with an average of 3.4 bedrooms and 1.8 full baths. On average, the listings for these homes were active on the market for over 3½ months at about 110 days. However, the median value was much lower at 26 days.
For comparison, there were closings for 47 homes in the 4th quarter of 2016. These homes had an average closing price of just over $460,000. The median price of $300,000 was much lower. The average size was about 2150 square feet with an average of 3.4 bedrooms and 2.1 full baths. 24 (~51%) of these homes offered one or two half-bathrooms also. Listings for these homes averaged 76 days active on the market. However, the median value here for this metric was much lower at 41 days also.
For further comparison, there were closings for 196 homes for the whole of 2016. These homes had an average closing price approaching $400,000 with a much lower median price just above $300,000. The average size was about 2050 square feet. These homes had an average of 3.3 bedrooms and 2 full baths; 94 (~48%) of them offered from 1 to 5 half-bathrooms. Their listings averaged 116 active days on the market but the median value for this metric was much lower at 59 days.
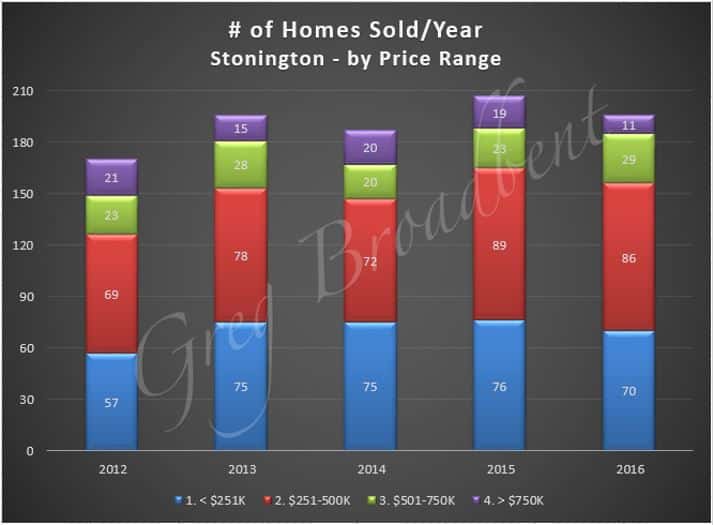
As far as longer term trends go, the graph below shows the number of homes sold per year from 2012 through 2016. Even though there was a slight decline in 2016 relative to 2015, the longer term trend does seem to have been positive.
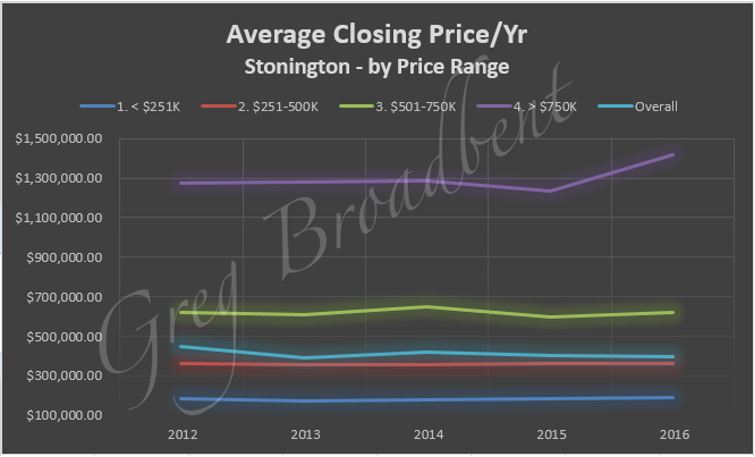
As the next chart suggests, average closing prices held more or less steady both overall and in each of the price ranges displayed for the last 5 years, except that the homes in the highest price range showed some upward movement in 2016.
We’ll continue to watch the residential property market and bring you additional observations and data in future blogs.
The trends reported above were based on data obtained from the CTMLS as of February 1st 2017 for single family residential properties. Updated information will be posted on our Stonington Real Estate Page.
If you are considering purchasing a home with in Stonington or if you would like to work with a CT Realtor in the area, please feel free to call us. We look forward to helping you find just the right home for you.

