
Summary
As a quick summary, local Realtors had 120 homes listed for sale in the Stonington area as of April 3rd. Note this includes the Stonington Borough and Pawcatuck as well as Masons Island. This 120 count is 2 higher than the count of 118 that were actively listed as of March 1st. Of these 120 listings, 89 were active a month ago on March 1st. Also, 54 of these same 120 listings were active 3 months ago on January 3rd. The CTMLS listed 24 homes as under deposit on April 3rd, up from the 14 that were under deposit on March 1st. Finally, real estate agents added 29 new listings to the CTMLS, and there were closings for 9 homes, during March.
Active Listings
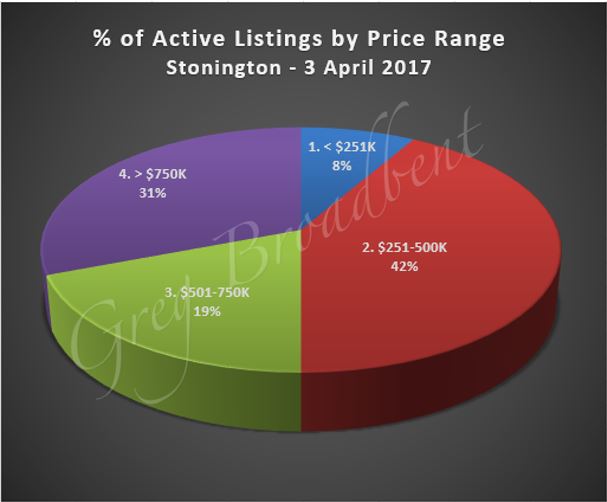
Listing prices covered a wide range running from $110,000 to almost $6M. The average listing price was around $830,000 and the median listing price was almost $512,000. The chart below gives a percentage breakdown of homes in different price ranges listed for sale in Stonington on April 3rd.
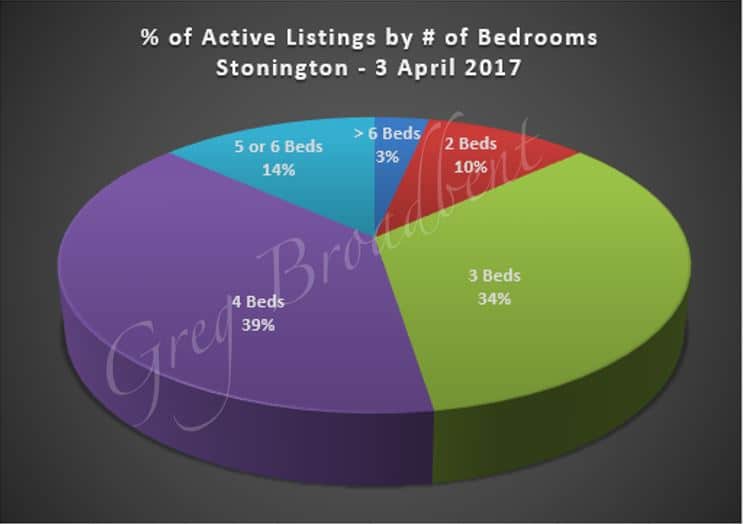
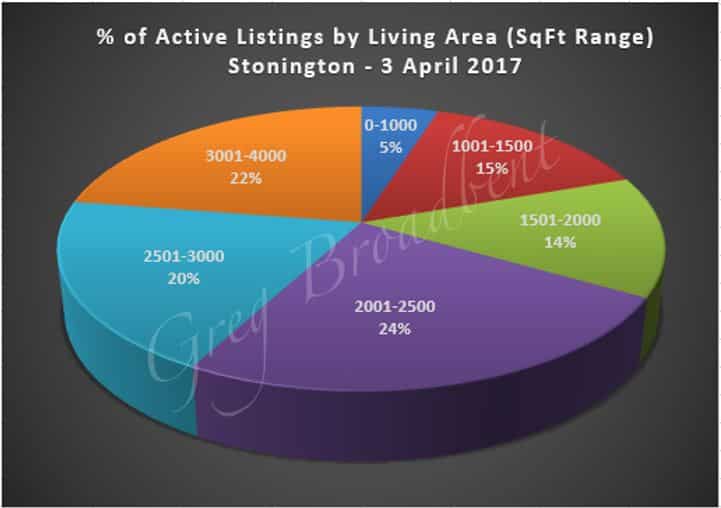
The size of the average house listed for sale in the Stonington area was a little over 2800 square feet with homes in the range of around 600 to over 7800 square feet. Homes had from 2 to 8 bedrooms with 3.8 being the average. In addition, they included from 1 to 8 full bathrooms with 2.6 being the average. Also, 58 (~48%) of these 120 homes offered between 1 and 5 half-bathrooms as well.
The following charts provide some additional perspective about the different numbers of bedrooms and ranges of living areas offered in these homes.
|
|
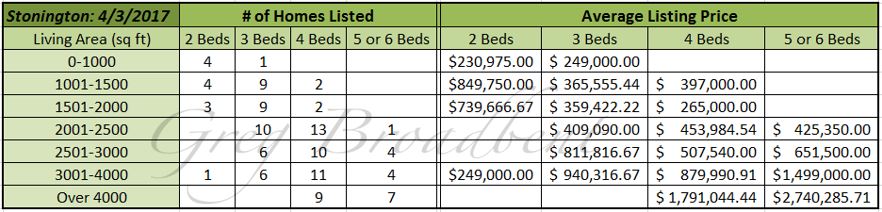
To complete the review of active listings, the chart below provides some additional detail. It shows the count of homes listed by number of bedrooms and range of living area size. In addition, it displays the corresponding average listing price for each combination of factors.
Recent Activity
There were 24 homes under deposit in Stonington as of April 3rd. The average price for these homes was just over $475,000 with the median a bit over $382,000 . These homes ranged in price from around $95,000 to almost $2M. The average home featured around 2400 square feet of living area with 3.4 bedrooms and 2.0 full bathrooms. Also, 13 (~54%) of them offered a single half-bathroom. On average, listings for the homes were active on the market for 129 days although the median was lower at 90 days.
There were closings for 9 homes in Stonington in March. The closing price averaged just under $305,000 but the median was much lower at $245,000. These homes averaged about 1825 square feet in size with an average of 3.1 bedrooms and 1.9 full baths. On average, the listings for these homes were active on the market for about 3 months at 100 days. The median value was much lower at 22 days.
Past Closings
For comparison, sales transactions closed for 30 homes in the 1st quarter of 2017, including March. These homes had an average closing price of just under $345,000 with a lower median price of $293,750. Also, the average size was a little over 2000 square feet with an average of 3.3 bedrooms and 2.0 full baths. In addition, 16 (~53%) of these homes offered one or two half-bathrooms as well. Finally, listings for these homes averaged 105 days active on the market with a median value at 26 days.
For additional comparison, 196 home sales closed in Stonington for the whole of 2016. The average closing price for these homes was just under $400,000. However, there was a much lower median closing price at just above $300,000. The average size was about 2050 square feet. Also, these homes had an average of 3.3 bedrooms and 2 full baths. 94 (~48%) of them offered from 1 to 5 half-bathrooms. Finally, corresponding listings averaged 116 active days on the market. The median value was much lower at 59 days.
Longer-Term Review
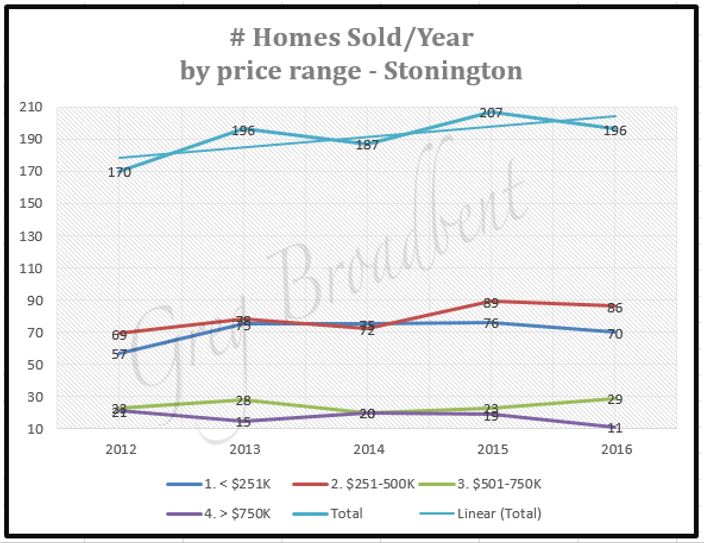
As far as longer term trends go, the graph below shows the number of homes sold per year from 2012 through 2016. It shows the counts of homes sold in different price ranges as well as the overall total. In addition, a “linear trend line” has been added using MS-Excel. Even though there was a slight decline in 2016 relative to 2015, and the 1st quarter volume is a bit lagging, the trend line does have a positive slope.
The chart below shows a 12-month quarterly “rolling average” of closing prices broken down by number of bedrooms. It shows averages for homes with 2-6 bedrooms as well as the overall average for the 5-year period ending with 1Q2017. This suggests that the average closing price and for homes with 2-4 bedrooms have more or less held steady. Also, noting that closing price can be influenced by a variety of factors not represented here, the closing prices for 5-6 bedroom homes seem to have generally increased.
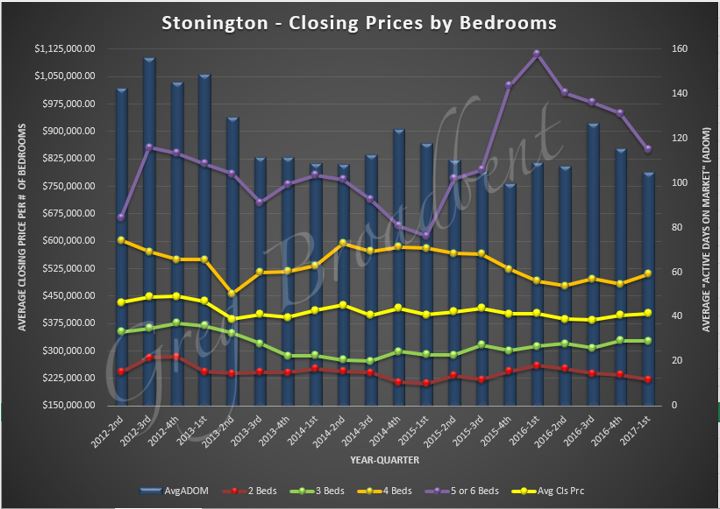
Finally, the blue bars in the chart above also show a 12-month quarterly “rolling average” for number of days listings stayed active on the market for the same period. This suggests that the amount of time a home remains listed before being sold has decreased since 2012 despite the fluctuations.
Conclusion
We’ll continue to watch the residential property market and bring you additional observations and data in future blogs.
The trends reported above were based on data obtained from the CTMLS as of April 3rd 2017 for single family residential properties. Updated information will be posted on our Stonington Real Estate Page.
If you are considering purchasing a home with in Stonington or if you would like to work with a CT Realtor in the area, please feel free to call us. We look forward to helping you find just the right home for you.

