In summary, local real estate agents had 37 residential properties listed for sale in Gales Ferry as of December 1st which is 8 fewer than the 45 that were listed on the 1st of the preceding month. Of these, 31 were also listed on November 1st and 19 of those same listings were active 3 months previously on September 1st as well. There were 5 homes under deposit on December 1st. Finally, closings were completed for 7 homes in November and 5 new listings were added.
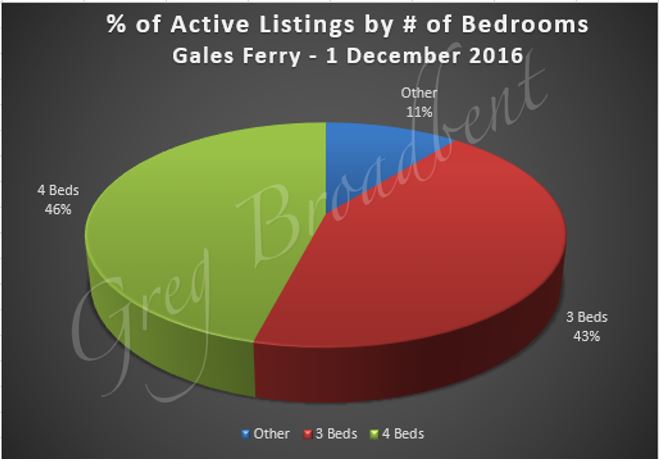
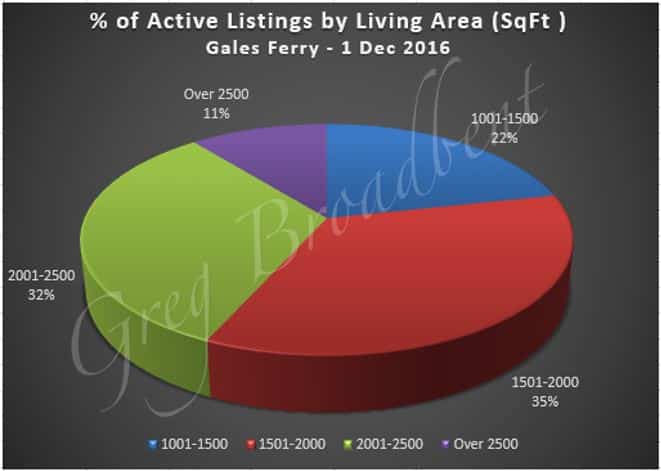
Average asking prices for the actively listed homes ranged from $105,000 to about $455,000 with the average listing price at almost $260,000 and $245,000 as the median. The living area for these homes ranged from about 1200 to almost 3800 square feet with the average and median square foot values both being a little under 2000 square feet. The homes had between 2 and 5 bedrooms with 3.6 as the average. They had 1 to 4 full bathrooms as well, with the average being 2; 21 (~ 57%) of these 37 homes had at least one half-bathroom. The following charts give a graphic breakdown of the percent of the active listings featuring a given number of bedrooms and range of living area.
|
|
Since prices will vary based on such features as living area and number of bedrooms, the chart below provides some additional detail about the number of homes listed by number of bedrooms and range of living area size, as well as the corresponding average listing price.
There were 5 homes under deposit in Gales Ferry on December 1st, down 5 from the 10 which were listed as under deposit as of November 1st. The average price for these homes was a little under $215,000 with prices ranging from $155,000 to almost $295,000.
These homes had an average size of about 2150 square feet with an average of 1.6 full bathrooms and 3.6 bedrooms. On average, the listings for homes under deposit as of December 1st were active on the market for between 18 and 170 days with an average of about 2.5 months at 72 days.
There have been 100 closing transactions for homes in Gales Ferry so far this year in 2016. These homes varied greatly in closing prices between $37,000 and $500,000 with an average of a little under $222,500 and a median closing price about $5K less at just under $217,500. These homes had a wide range of living areas as well, going from about 865 to almost 4500 square feet of living area. The average living area was about 1785 square feet and the median at about 1740. There were between 2 and 5 bedrooms in the homes with the average at 3.5 bedrooms. The average number of full bathrooms was 1.8 with the number ranging from 1 to 4; 55 of these 100 homes had at least one half-bathroom. Finally, the listings for these homes were active for between 1 and 380 days, with 83 days as the average and 63 as the median.
For comparison, there were 104 closings in Gales Ferry the previous year in 2015. Closing prices for these homes were in a slightly narrower range from $45,000 to about $440,000 with the average and median closing prices a bit lower at almost $213,000 and $207,500 respectively. Homes sizes varied from about 865 to almost 3200 square feet with the average and median sizes at about 1755 and 1680 square feet respectively. They had an average of 3.3 bedrooms and 1.8 full bathrooms; 57 (~ 55%) of the 104 homes had at least 1 half-bathroom. The listings for these homes had been active on the market for an average of 74 days, just about 2.5 months, and the median number of days listed was 46 days – just about 1.5 months.
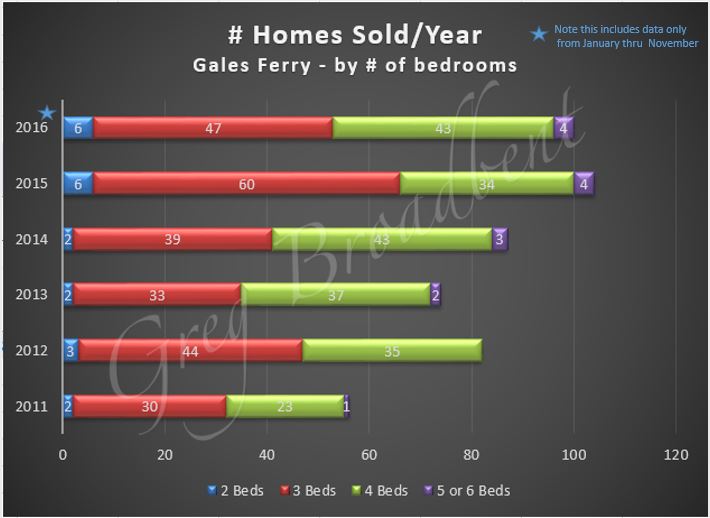
As far as longer term trends go, the graph below shows the number of homes sold per year since 2011, noting that there are only 11 months of data for 2016. This shows that the number of homes sold was greater in 2014 than for the preceding 3 years, and 2015 beat 2014 in terms of homes sold. 2016 looks to be comparable to 2015 in total units sold, with the main difference being the number of 3 and 4 bedroom homes sold in those years.
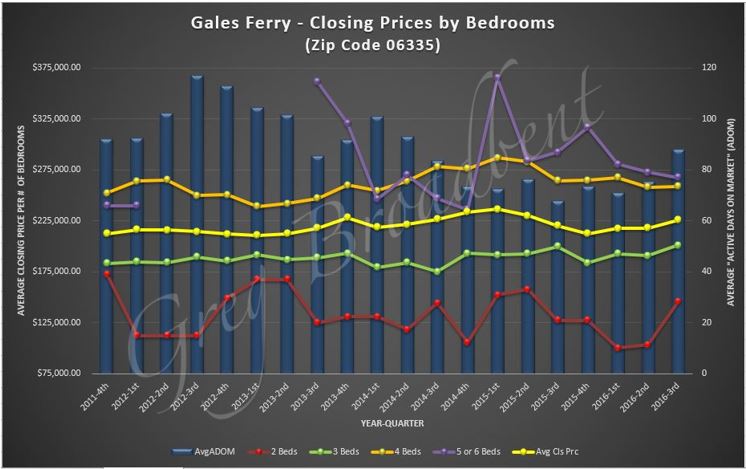
The chart below provides some information on closing prices. It shows a 12-month quarterly “rolling average” of closing prices for homes sold over the past 5 years in total and broken down by number of bedrooms (for homes having 2-6 bedrooms). It suggests that in general, and for homes with 3 and 4 bedrooms specifically, prices have held pretty steady over the past 5 years. The prices for 2 and 5-6 bedroom homes did seem to fluctuate a bit more, but as the chart above showed, these homes have been far fewer in number so it’s not surprising that their averages showed more fluctuation, even using the rolling average.
Also, in the background bars, the chart above shows a 12-month quarterly rolling average for “Active Days on Market” regardless of the number of bedrooms. This suggests that the average duration of the listing leading to a sale has been fairly steady in a range of 70 to 90 days since the end of 2014, although there was a notable increase in the recent quarter.
We’ll be monitoring the market over the coming months to see if there are other trends or data of interest which we can share with you in future blogs.
The data reported above was taken from the CTMLS as of December 1st 2016 for single family homes. Updated information will be posted on our Gales Ferry Real Estate Page. If you are looking for a home in Gales Ferry or if you would like to work with a local CT Realtor, please feel free to call us. We look forward to helping you find just the right home for you.


