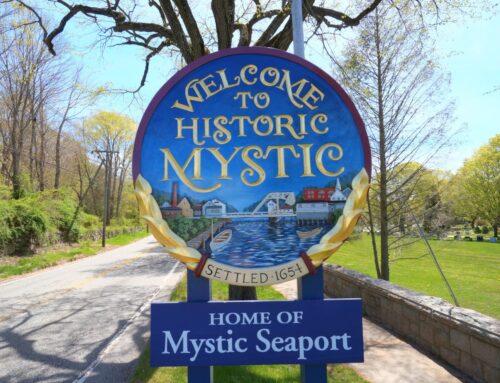
The Mystic Real Estate market is trending positively. There are currently 129 active listing on the market. This is both the Groton CT side and Stonington CT sides of the river. This is up from 102 in March but that is to be expected with the seasonal changes. The average list price is slightly lower from $565 down to $534. The high is $3.2m and the low is $150k. The active days on the market has gone down 7 to 153 and the median days has gone down 63 days to 88.
| Beds | Baths | SqFt | Listing Price | LP$/SqFt | Sale Price | SP$/SqFt | SP/LP | ADOM | |
|---|---|---|---|---|---|---|---|---|---|
| High | 6 | 4.5 | 7,000 | $3,200,000 | $1,545.45 | $0 | $0 | 0% | 959 |
| Low | 1 | 0 | 517 | $150,000 | $79.26 | $0 | $0 | 0% | 1 |
| Average | 3 | 2.18 | 2,135 | $534,609 | $246.31 | $0 | $0 | 0% | 153 |
| Median | 3 | 2.1 | 2,019 | $389,900 | $198.37 | $0 | $0 | 0% | 88 |
There are currently 23 homes under deposit within Mystic/06355. This is lower than I would have expected for this time of year and even 1 house less than in March, historically one of the slower months. The average and median prices rose and the average days on the market rose as well.
| Beds | Baths | SqFt | Listing Price | LP$/SqFt | Sale Price | SP$/SqFt | SP/LP | ADOM | |
|---|---|---|---|---|---|---|---|---|---|
| High | 5 | 4 | 5,409 | $779,000 | $388.35 | $0 | $0 | 0% | 459 |
| Low | 3 | 1 | 936 | $110,000 | $57.26 | $0 | $0 | 0% | 4 |
| Average | 4 | 2.22 | 2,108 | $354,765 | $173.85 | $0 | $0 | 0% | 118 |
| Median | 3 | 2 | 1,921 | $297,000 | $161.7 | $0 | $0 | 0% | 74 |
Over the last 12 months, there have been 136 closed transactions from Mystic real estate agents. This is a good number for Mystic. At the peak of the market, we were selling almost 200 properties in a year. In the low of the market, we sold only 90 units. 136 closed transactions is a solid number and if the prices can rise and continue this trend, it will continue to be a stronger market. Sellers on average were getting 95% of their asking price and that number has not changed over the last 4 months. The average size of a home seemed to be sliding up slightly as well from 1953 square feet to 2002 and the median increasing a similar amount.
| Beds | Baths | SqFt | Listing Price | LP$/SqFt | Sale Price | SP$/SqFt | SP/LP | ADOM | |
|---|---|---|---|---|---|---|---|---|---|
| High | 10 | 8 | 10,349 | $2,950,000 | $712.86 | $2,850,000 | $657.11 | 110.2% | 509 |
| Low | 1 | 1 | 520 | $74,500 | $71.77 | $63,000 | $56.45 | 61.5% | 3 |
| Average | 3 | 2.03 | 2,002 | $394,027 | $193.73 | $370,979 | $182.38 | 94.63% | 110 |
| Median | 3 | 2 | 1,863 | $296,000 | $171.33 | $287,000 | $163.81 | 96% | 69 |
The following information is based CTMLS on single family residential homes within the 06355 zip code as of 7/29/14. You can find updated information on our Mystic Real Estate Trends Page at the bottom.


